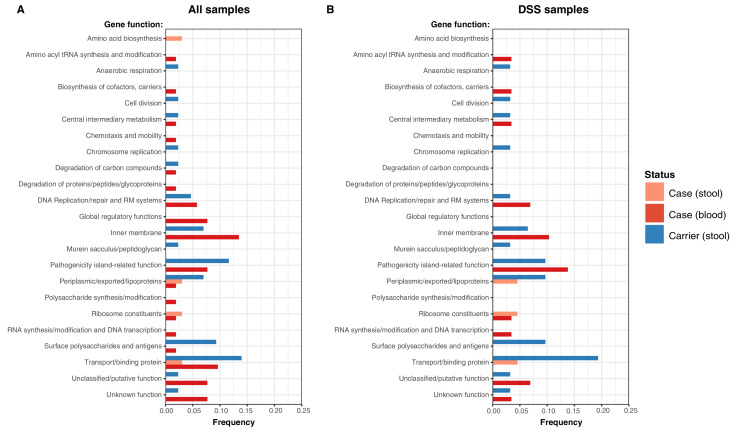
Figure 5. Frequency of terminal non-synonymous mutations in difference gene functional categories among cases and carriers.
(A) Frequency of terminal non-synonymous mutations in all sequences collected. (B) Frequency of terminal non-synonymous mutations in sequences from within the DSS area. Red bars indicate the frequency non-synonymous mutations found in acute case samples from blood, peach bars indicate non-synonymous mutations found in acute case samples from stool, and blue bars indicate the frequency of mutations found in carrier samples from stool.

