. 2021 Sep 21;10:e68910. doi: 10.7554/eLife.68910

Figure 1. Golgi dispersal by nicotine exposure in non-excitable, α4β2R-expressing human embryonic kidney (HEK) cells.

(A) Time course of Golgi dispersal by nicotine. HEK293 cells stably expressing α4β2Rs (α4β2R cells) were transfected with GFP-tagged galactosyltransferase (GalT, green) and imaged at the indicated times after nicotine exposure (10 μM). Cells were also labeled with DAPI (blue) after fixation. Scale bar, 10 μm. (B) Dose dependence of Golgi dispersal by nicotine. Cells were fixed after 17 hr of nicotine exposure at the indicated concentrations and then stained with anti-GM130 antibody (red) and DAPI (blue) before imaging. Scale bar, 10 μm. (C) Heterogeneity of Golgi components in nicotine-dispersed Golgi fragments. α4β2R cells were transfected with GFP-GalT (blue) and St3-GFP (green) and nicotine-treated as in A prior to fixation and staining for GM130 (red). Scale bar, 10 μm. (D) Numbers of dispersed Golgi puncta per cell that contain both GM130 and St3, or only St3. Total number of puncta per cell, data are shown as mean ± SEM. For left graph, untreated cells, 3.9 ± 1.1; nicotine-treated cells, 34.6 ± 9.0 (n = 8–10 cells per group, **p < 0.05). For right graph, control cells, 62.6 ± 6.9; nicotine cells, 124.1 ± 8.9 (n = 10 cells per group, ***p < 0.00001). (E) Nicotine-treatment does not alter Golgi morphology in cells that do not express α4β2R. HEK293 cells without α4β2Rs were transfected with GalT-GFP and then treated with or without nicotine (10 μM) for 17 hr and imaged. Scale bar, 10 μm.

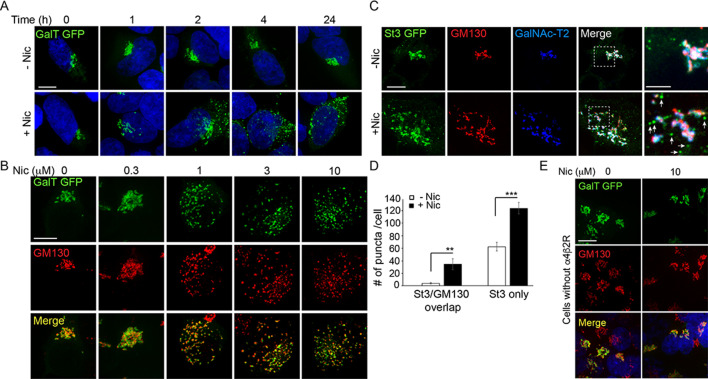
Figure 1.

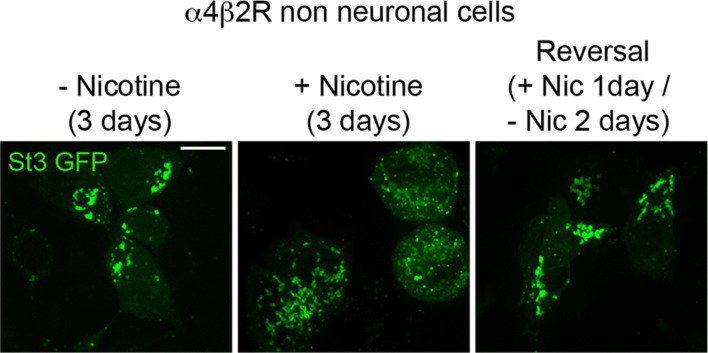
Figure 1—figure supplement 1. Reversal of nicotine-induced Golgi dispersal.

Figure 1—figure supplement 1.

α4β2R cells were transfected with St3-GFP for 24 hr and treated with or without 10 μM nicotine for 1 day. To visualize reversal, cells were washed with media to remove nicotine and maintained in drug-free media for 2 days. A parallel set of nicotine-treated cells were maintained in nicotine for the duration of the experiment. Untreated cells were maintained in nicotine-free media. Representative images of the cells under the three conditions are displayed. Scale bar, 10 μm.
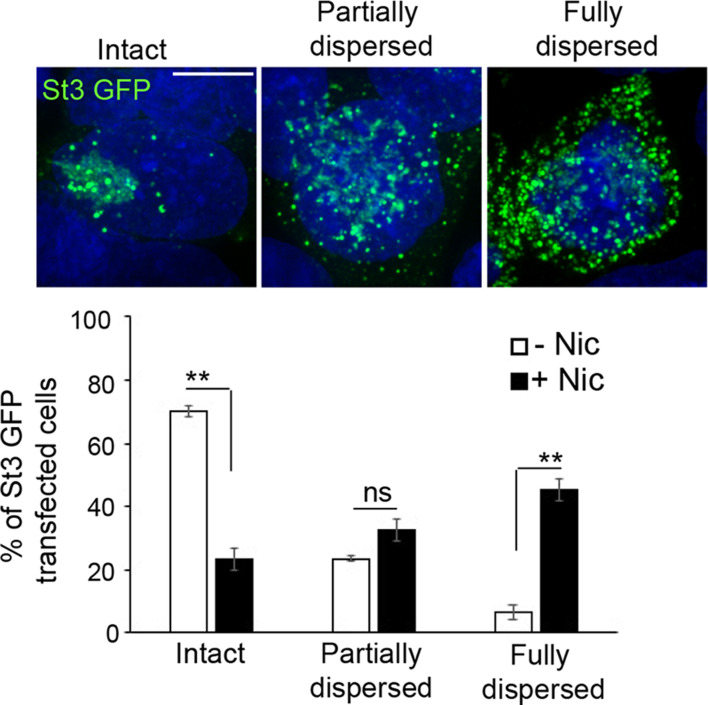
Figure 1—figure supplement 2. Classification and quantification of cells into three categories (intact, partially dispersed, and fully dispersed) based on Golgi integrity and morphology.

Figure 1—figure supplement 2.

α4β2R cells were transfected with St3-GFP (green) for 24 hr and treated with or without 10 μM nicotine for 17 hr. Cells were fixed and stained with DAPI (blue). Top, representative images of cells with intact, partially dispersed and fully dispersed Golgi. Bottom, percentage of St3-GFP transfected cells with each phenotype were quantified under nicotine-treated and untreated conditions. Data represents mean ± SEM (n = 4 independent experiments; total number of St3-GFP transfected cells analyzed; control cells, 487; nicotine cells, 469; percentage of cells with intact Golgi, control cells, 69% ± 1.7%; nicotine cells, 23.3% ± 3.6%, con vs nic, **p < 0.0002; partially dispersed Golgi, control cells, 23.3% ± 1%; nicotine cells, 32.3% ± 3.4%, con vs nic, p = 0.14663, not significant; dispersed Golgi, control cells, 6.2% ± 2.2%; nicotine cells, 45.2% ± 3.2%, con vs nic, **p < 0.0002). Scale bar, 10 μm.