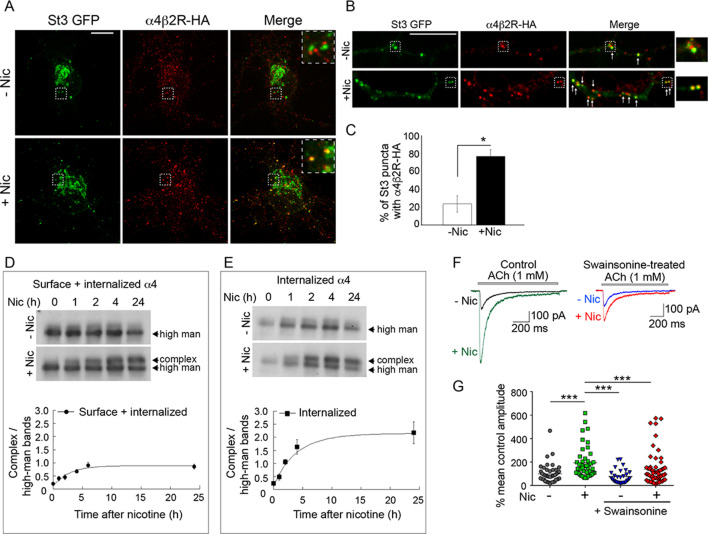
Figure 7. Surface α4β2Rs glycan modification and functional changes after endocytosis and trafficking to Golgi satellites.
(A–B) Endocytosed α4β2Rs co-localize with Golgi satellites in the somata (A) and dendrites (B) of neurons. Scale bars, 10 µm. Cortical neurons were transfected with St3-GFP (green) and HA-tagged α4β2R subunits and treated with (+Nic) or without (-Nic) 1 μM nicotine for 17 hr. To measure α4β2R endocytosis, cultures were labeled with anti-HA Ab for 30 min, washed, and cells incubated at 37°C for 2 hr. Afterward, cells were acid washed to remove surface receptor Abs, fixed, permeabilized, and endocytosed α4β2Rs visualized (red). Arrows mark where endocytosed α4β2Rs co-localize with Golgi satellites. (C) Quantification of the percentage of Golgi satellites that co-localized with endocytosed α4β2R. Data are displayed as mean ± SEM, control cells, 23.8 ± 9.0; nicotine cells, 76.9 ± 7.5 (n = 7–11 neurons per group, *p < 0.0002). Quantitative analysis was conducted on three independent culture preparations. (D) Time course of the α4 subunit glycan modification of the surface and internalized pools of α4β2Rs. Top: α4β2R cells were surface biotinylated with cleavable sulfo-NHS S-S biotin at time 0. Cultures were incubated at 37°C and followed in the presence or absence of 10 μM nicotine for the indicated times (hr). At each time point, biotinylated proteins, both cell surface and internalized/endocytosed, were precipitated with streptavidin agarose, and immunoblotted with anti-α4 antibody. Bottom: Densitometry of α4 subunit bands from four separate experiments as in top panel and plotted as in Figure 6G. (E) Time course of the α4 subunit glycan modification of the internalized pools of α4β2Rs. Top: Surface biotinylation was performed as in D at time 0. At each time point, surface biotin was cleaved using glutathione. The remaining internalized/endocytosed biotinylated receptors were isolated using streptavidin agarose and analyzed using immunoblot. Bottom: Densitometry of α4 subunit bands from three separate experiments as in top panel and plotted as in Figure 6G. (F–G) Block of α4β2R glycan modification by α-mannosidase inhibitor, swainsonine, prevents α4β2R functional upregulation by nicotine. (F) Swainsonine treatment blocks nicotine-induced increases in α4β2R current responses. Control (left): A 17–20 hr treatment with nicotine (Nic, 10 μM) induced an approximately fivefold, increase in ACh-evoked (1 mM ACh) current amplitudes in α4β2R-expressing HEK cells. Swainsonine-treated (right): ACh-evoked (1 mM ACh) current amplitudes for swainsonine and nicotine-treated cells. α4β2R cells were treated with swainsonine, for 2 hr and then swainsonine and nicotine for 17 hr. (G) Scatter plot of all ACh-evoked current amplitudes plotted as the percentage of mean control current amplitude. Control vs. nicotine p < 0.0001; nicotine vs. control and swainsonine-treated p < 0.001; nicotine vs. nicotine and swainsonine-treated p = 0.0054; control and swainsonine-treated vs. nicotine and swainsonine-treated p = 0.082 (not significant).


