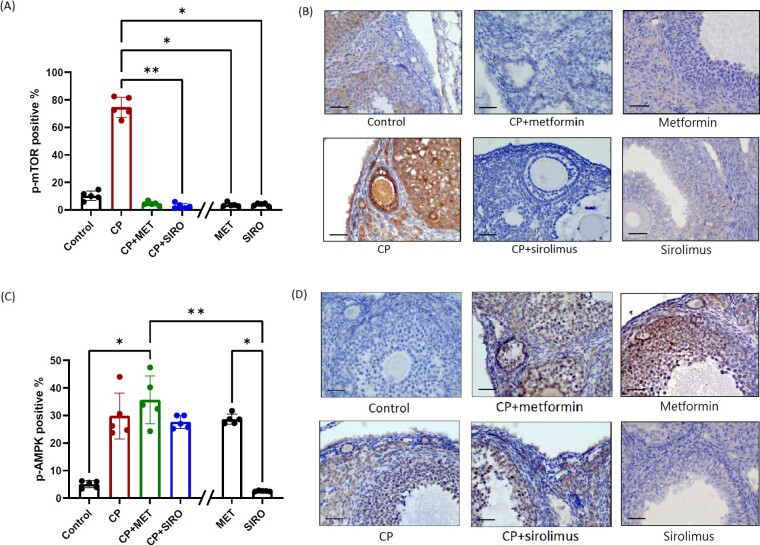
Figure 3.
Immunohistochemical (IHC) staining of the proteins involved in mTOR signaling pathway. C57BL/6 mice were treated with CP-alone, metformin (MET)-alone, sirolimus (SIRO)-alone or CP in combination with MET or SIRO. After 4 weeks of treatment, the ovaries were processed into paraffin sections for the IHC detection of p-mTOR (A, B) and p-AMPK (C, D) proteins. The percentage of granulosa cells with positive staining was calculated by dividing the number of positive stained cells with the total number of granulosa cells in ovarian follicles under a microscopy at ×400 magnification. One largest tertiary follicle in each section was selected to calculate the number of positively stained cells. Five sections per mice were counted from a total of 5 mice in each group (n = 5 mice). Data are expressed as the mean (%) ± standard deviation. Statistical analyses were performed by nonparametric Kruskal–Wallis test with Dunn's post-hoc for multiple comparisons. *P < 0.05, **P < 0.01. The scale bar is 50 μm. Note: The double slash mark on the X axis separated the MET-alone and SIRO-alone group from other groups because these two control groups were run in a separate experiment.

