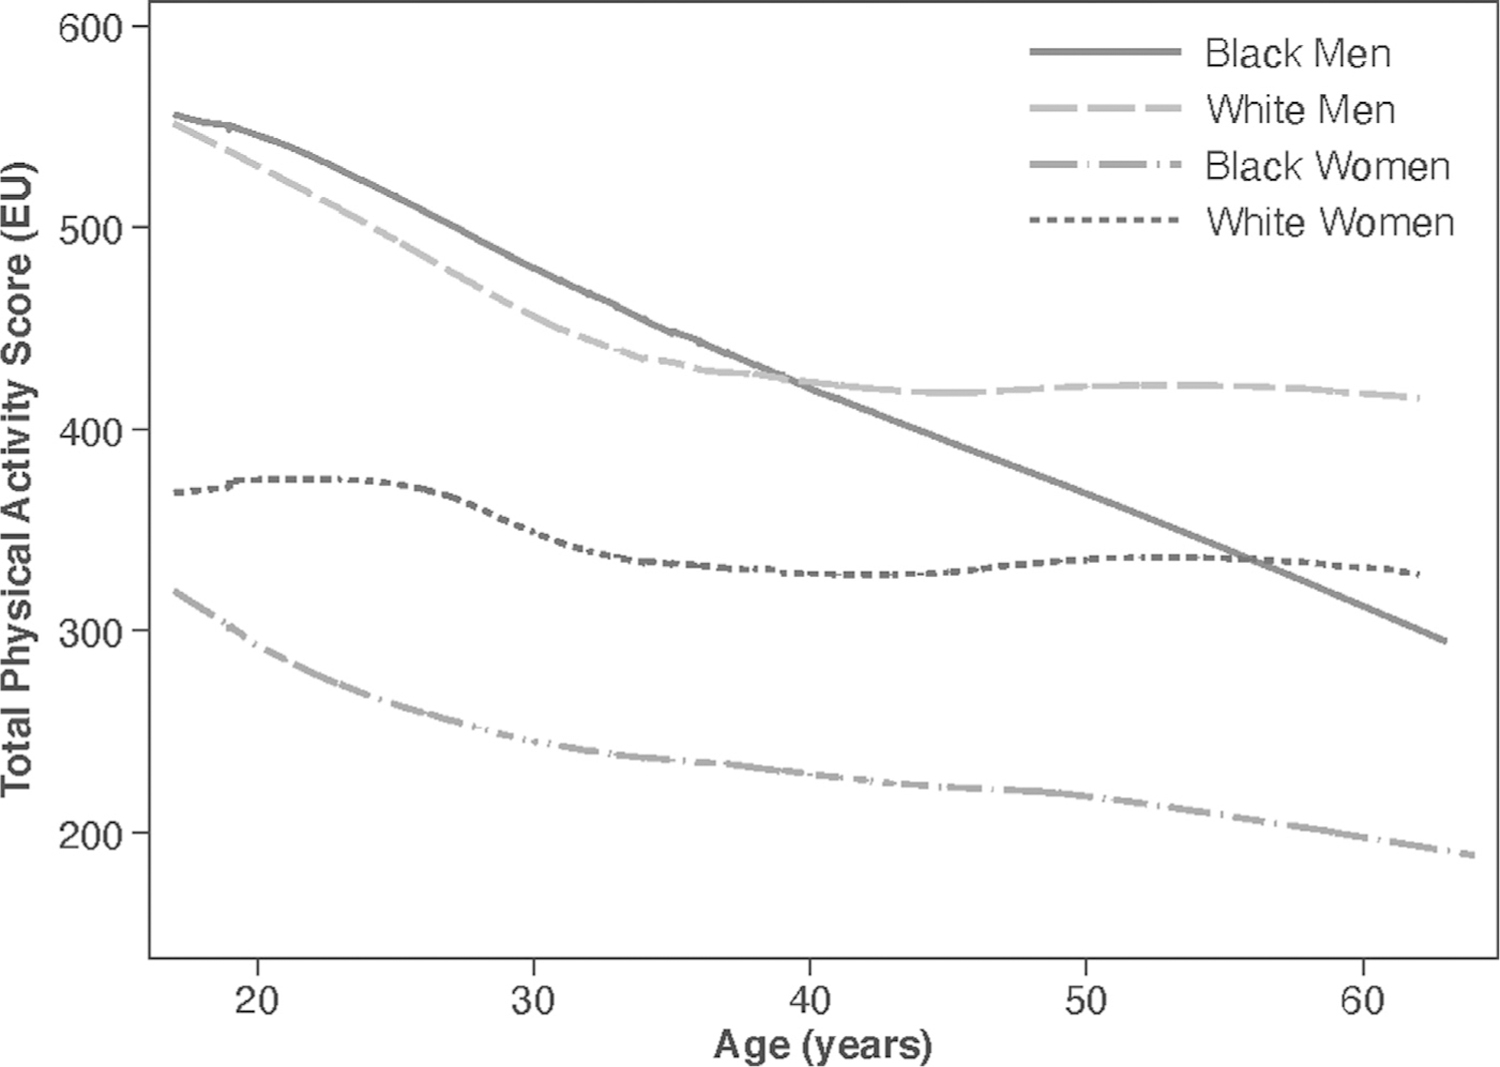
Figure 1. Average physical activity trajectories.

Note: A total physical activity score of 300 EUs approximates the HHS recommendations of approximately 150 minutes of moderate-intensity activity per week. The figure represents the group average of total physical activity score by race and sex groups using locally Weighted Scatterplot smoothing. Appendix Figure 1 (available online) shows the physical activity trajectories with 95% prediction intervals by race and sex. Appendix Figure 2 (available online) shows the average physical activity trajectories when physical activity observations after hypertension onset do not contribute. EU, exercise unit.
