
Fig. 2.
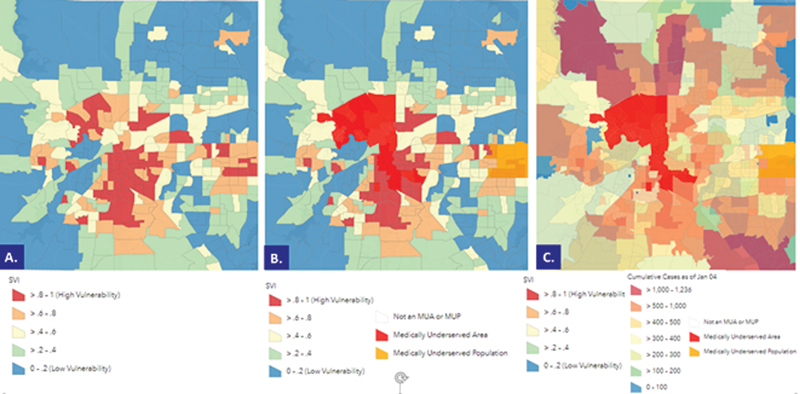
Color-coded SVI Census tracts (CTs), Medically Underserved Areas (MUAs), and Medically Underserved Populations (MUPs), along with cumulative COVID-19 cases (as of Jan.4, 2021) within the project county. ( A ) Color-coded SVI census tracts; areas in dark red depict CTs with an SVI > 0.8, the county's highest vulnerability locations. ( B ) Color-coded SVI census tracts overlaid with MUAs and MUPs. Areas in bright red depict MUAs. ( C ) Color-coded SVI census tracts overlaid with MUAs, MUPs, and cumulative COVID-19 cases. Areas in dark pink and light pink represent areas with the largest number of cumulative COVID-19 cases within the project county. COVID-19, novel coronavirus disease 2019; SVI, Social Vulnerability Index.