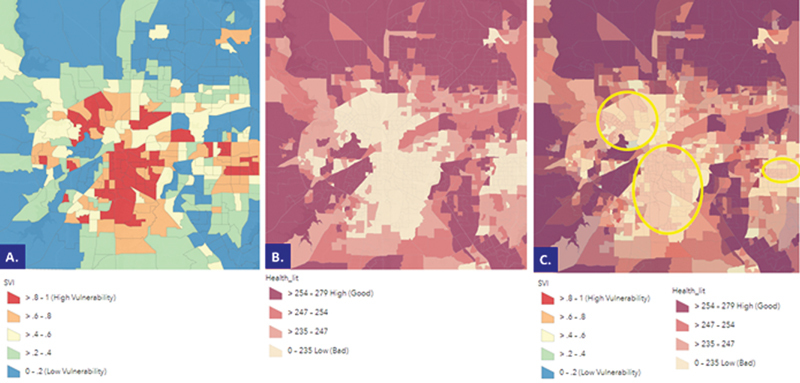
Fig. 3.

Color-coded CDC SVI census tracts and health literacy levels within the project county. ( A ) Color-coded CDC SVI census tracts; areas in dark red depict Census tracts (CTs) with an SVI > 0.8, the county's highest vulnerability locations. ( B ) Color-coded health literacy levels within the project county. Areas in light yellow represent areas within the National Quartile 1 (i.e., lowest literacy level). ( C ) Color-coded CDC SVI census tracts and health literacy levels within the project county. Yellow circled areas are highly vulnerable areas (dark red) where health literacy is low (light yellow). CDC, Centers for Disease Control and Prevention; SVI, Social Vulnerability Index.
