
Fig. 4.
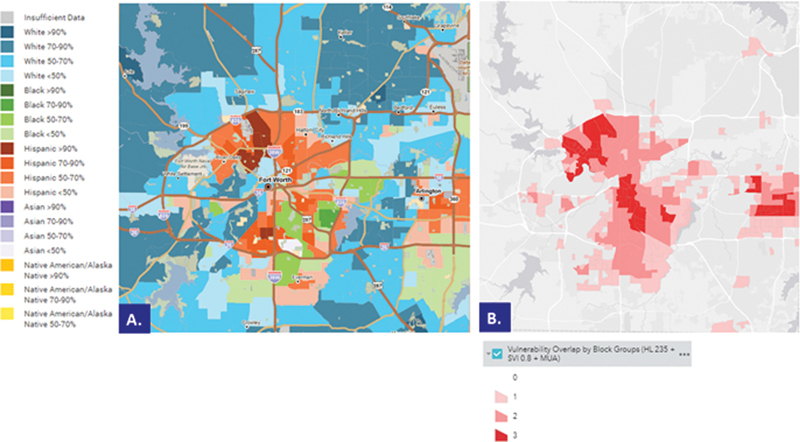
Color-coded racial and ethnic groups, SVI census tracts, low health literacy level areas, and Medically Underserved Areas (MUAs), and Medically Underserved Populations (MUPs) within the project county. ( A ) Color-coded percentage of predominant racial or ethnic groups (PolicyMap LLC, Philadelphia, Pennsylvania). 29 ( B ) Color-coded SVI > 0.8 census tracts with low health literacy levels (0–235, National Quartile 1), and MUAs and MUPs within the project county. SVI, Social Vulnerability Index.