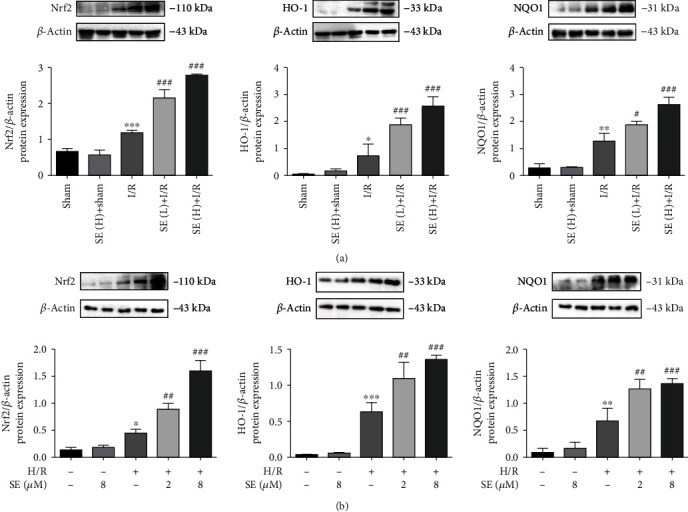
Figure 6.

Western blotting analysis of protein expression: (a) Nrf2/HO-1/NQO1 protein expression in the sham, sham+SE (H), I/R, I/R+SE (L), and I/R+SE (H) group (n = 3); (b) Nrf2/HO-1/NQO1 protein expression in the IEC-6 cell, IEC-6 cell+SE, H/R-injured IEC-6 cell, I/R-injured IEC-6 cell+SE (2 μM), and I/R-injured IEC-6 cell+SE (8 μM) group (n = 3). Data are expressed as mean ± SEM. ∗P < 0.05, ∗∗P < 0.01, and ∗∗∗P < 0.001vs. the sham group; #P < 0.05, ##P < 0.01, and ###P < 0.001vs. the H/R group. SE: sesamin.
