Figure 10.

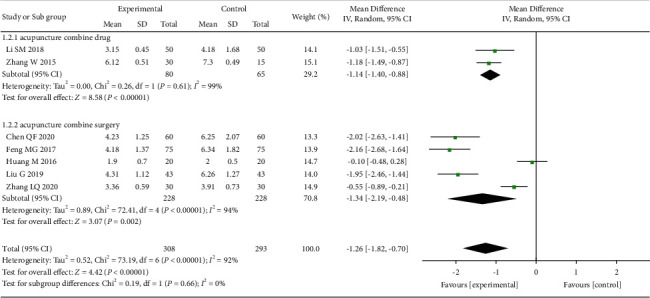
The forest plot shows the comparison of VAS between the acupuncture and control group in 1 week of treatment for pain caused by OVCF, subgroup analysis based on different treatment methods.

The forest plot shows the comparison of VAS between the acupuncture and control group in 1 week of treatment for pain caused by OVCF, subgroup analysis based on different treatment methods.