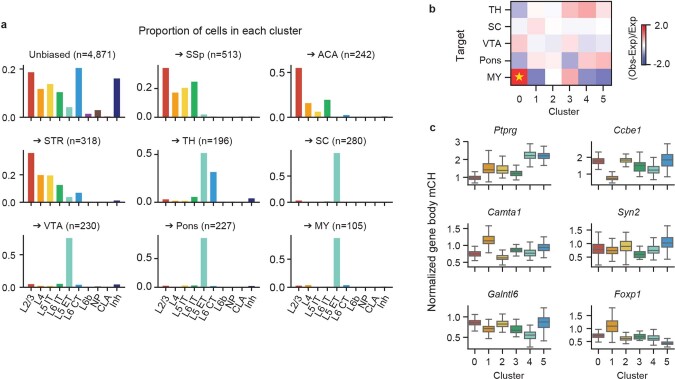
Extended Data Fig. 3. Epi-retro-seq links molecular cell types with distal projection targets.
a, Distribution across subclasses of neurons from unbiased snmC-seq2 and neurons projecting to each target. b, Enrichment of L5 ET neurons projecting to each target in each cluster. * represents FDR < 0.05, Wald test, Benjamini-Hochberg Procedure. c, Boxplots of normalized mCH levels at gene bodies of example CH-DMGs in the six clusters. Numbers of cells represented by the boxes are 242, 165, 118, 42, 119, and 162 for the six clusters. The elements of boxplots are defined as: center line, median; box limits, first and third quartiles; whiskers, 1.5× interquartile range.

