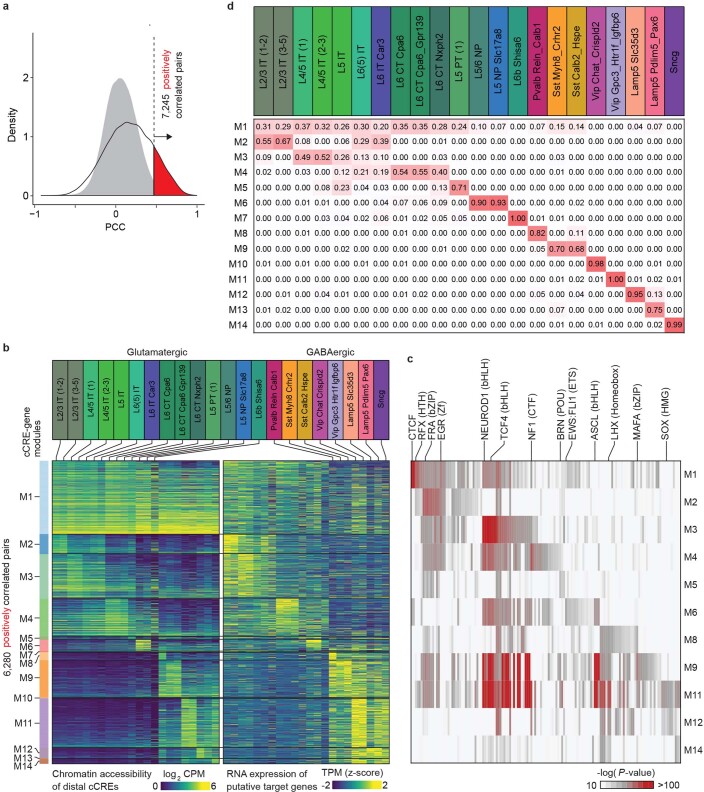
Extended Data Fig. 6. Identification of putative enhancer-gene pairs.
a, Detection of putative enhancer-gene pairs. 7,245 pairs of positively correlated cCRE and genes (highlighted in red) were identified using an empirically defined significance threshold of FDR < 0.01. Grey filled curve shows the distribution of PCC for randomly shuffled cCRE-gene pairs. b, Heatmap of chromatin accessibility of 6,280 putative enhancers, grouped by distinct enhancer-gene modules, across joint cell clusters (left) and expression of 2,490 target genes (right). Note genes are displayed for each putative enhancer separately. CPM: counts per million, TPM: transcripts per million. About 76% of putative enhancers showed cluster-specific chromatin accessibility and were enriched for lineage-specific TFs, while 24% were widely accessible and linked to genes expressed across neuronal clusters with the highest expression in glutamatergic neurons (module M1). Other modules (M2 to M14) of enhancer-gene pairs were active in a subclass-specific manner. c, Enrichment of known TF motifs in distinct enhancer-gene modules. Displayed are known motifs from HOMER with enrichment -log p-value > 10. In module M1, de novo motif analysis of putative enhancers showed enrichment of sequence motifs recognized by TFs CTCF and MEF2. CTCF is a widely expressed DNA binding protein with a well-established role in transcriptional insulation and chromatin organization, but recently it was also reported that CTCF can promote neurogenesis by binding to promoters and enhancers of related genes. In the L2/3 IT selective module M2, putative enhancers were enriched for the binding motif for Zinc-finger transcription factor EGR, a known master transcriptional regulator of excitatory neurons89. In the Pvalb selective module M8, putative enhancers were enriched for sequence motifs recognized by the MADS factor MEF2, which is associated with regulating cortical inhibitory and excitatory synapses and behaviours relevant to neurodevelopmental disorders90. d, Heatmap showing the weight of each joint cell cluster in each module, derived from the coefficient matrix. The values of each column are scaled (0–1).

