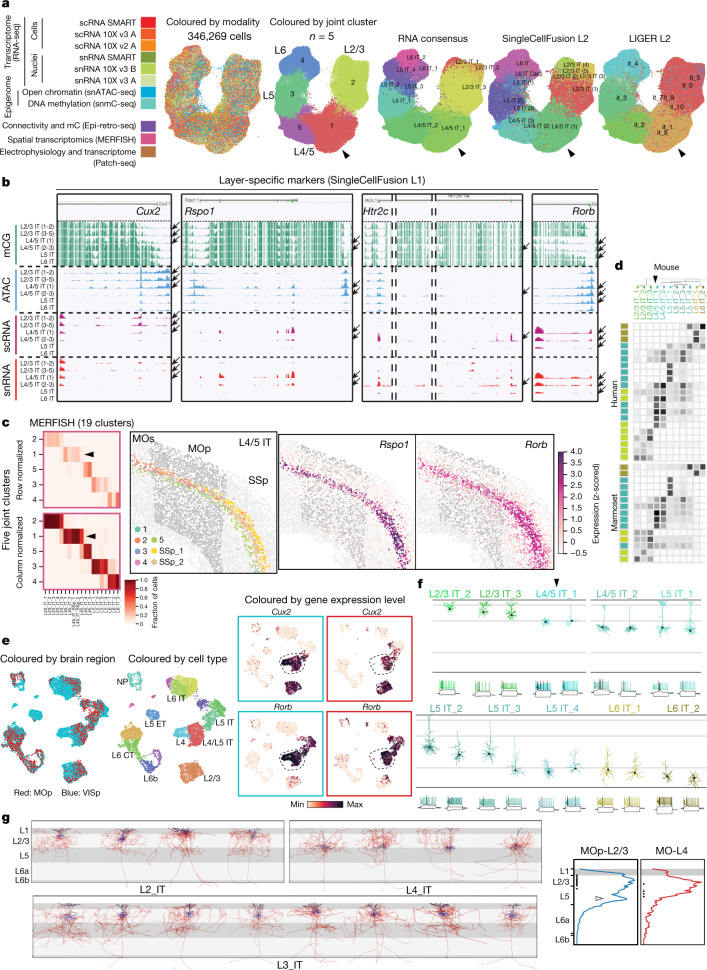
Fig. 7. Existence of L4 excitatory neurons in MOp.
a, UMAP embedding of IT cells from 11 datasets. Cells are coloured by modalities, by cluster identities from the 11-dataset joint clustering, and by cluster identities generated from other consensus clustering37. b, Genome browser view of layer-specific gene markers—from L2/3 to L5—across IT cell types (SCF L1)37. Arrows indicate cell types with correlated transcription and epigenomic signatures of the specific marker gene. c, MERFISH IT clusters correspond well with the joint clusters from a (confusion matrices, left), and reveal a group of L4 specific clusters (L45_IT) between L2/3 and L5 and marked by genes Rspo1 and Rorb (right). d, Correspondence between mouse and human or marmoset transcriptomic IT types. e, UMAP embedding of excitatory cells from MOp and VISp. Gene expression levels are log10(transcripts per million + 1). f, Dendritic morphologies and spiking patterns of mouse Patch-seq cells from L2/3-6 IT types. Arrowheads in a, c, d, f indicate the L4/5 IT_1 type. g, Left, local dendritic and axonal morphologies of fully reconstructed IT neurons with somas located in L2, L3 and L4. Black, apical dendrites. Blue, basal dendrites. Red, axons. Right, quantitative vertical profiles showing average distribution of local axons along cortical depth for L2/3 or L4 neurons. Dots indicate soma locations and the open arrowhead points to L2/3 neuron axon projections down to L5. Layer marking is approximate owing to the variable thickness of layers in different parts of MOp.

