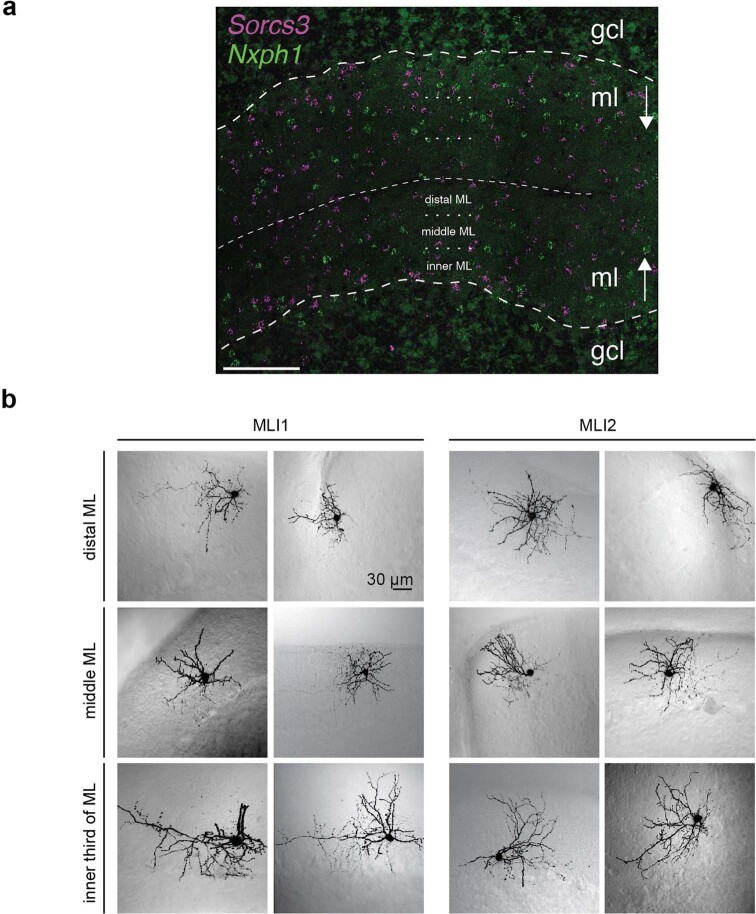
Extended Data Fig. 7. Additional imaging of MLI1 and MLI2 neurons.
a, Representative image of smFISH expression of Sorcs3 (purple) and Nxph1 (green) at low magnification. Scale bar, 100 μm. The distal, middle and inner molecular layer sublayer boundaries are designated with a dotted line; the thinner dashed line marks the outer boundary of cortical folds, and the thicker dashed line indicates the location of the Purkinje layer (n = 16 slides sectioned over 3 mice). b, MLIs were imaged and identified as in Fig. 4. Examples of MLI1s (left) and MLI2s (right) are shown for cells located in the distal third (top), the middle third (middle) and the inner third (bottom) of the molecular layer. n = 23 MLI1 cells and 20 MLI2 cells.

