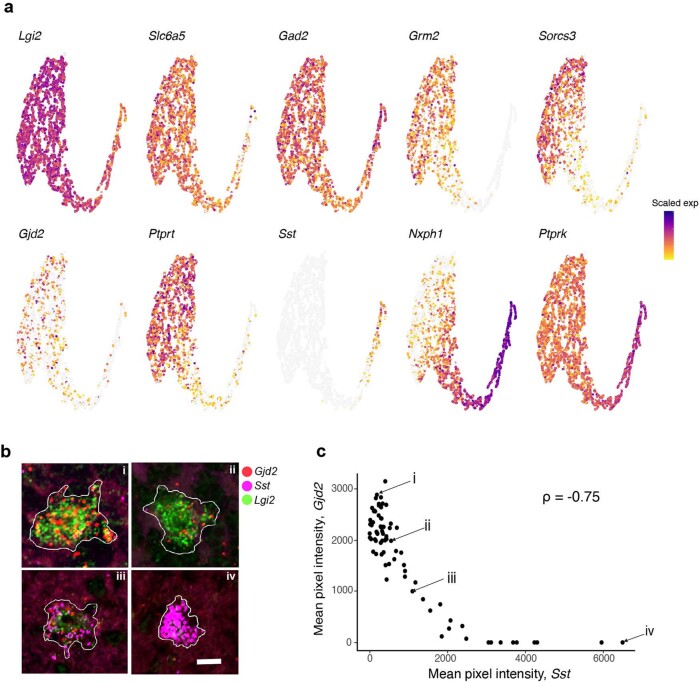
Extended Data Fig. 9. Molecular variation in Golgi interneuron clusters.
a, UMAP visualization of expression of selected genes in the two Golgi interneuron clusters, showing variation in many of the same genes that define the MLI1/MLI2 distinction (Sorcs3, Gjd2 and Nxph1). b, Four representative Golgi cells from an smFISH experiment for Lgi2 (Golgi cell marker, green), Sst (Golgi_2 marker, purple), and Gjd2 (higher in Golgi_1, red). Scale bar, 50 μm. n = 77. c, Quantification of mean smFISH pixel intensity for the genes Sst and Gjd2, across 77 cells. The four representative cells in b are labelled with the corresponding Roman numeral. Spearman correlation (ρ) is shown.

