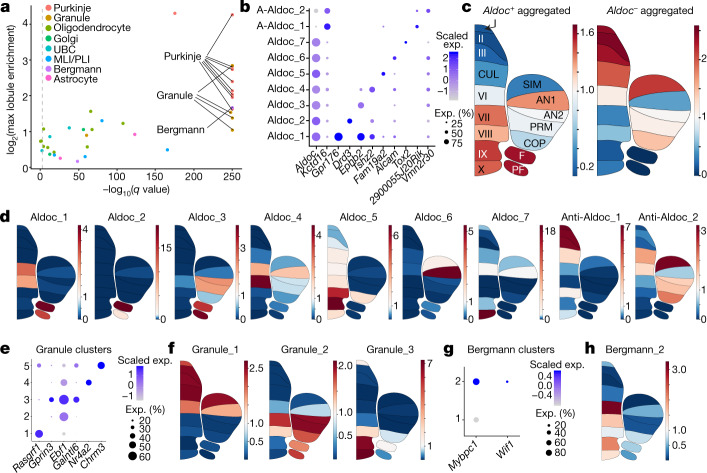
Fig. 2. Characterization of spatial variation and patterning in neuronal and glial cell types.
a, Plot indicating neuronal and glial clusters that have lobule enrichment patterns that are significantly different from the cell type population as a whole (Pearson’s chi-squared, FDR < 0.001 indicated by dashed line). x-axis shows −log10-transformed q values; y axis shows log2-transformed maximum lobule enrichment across all 16 lobules (Methods). Clusters with high correlation (Pearson correlation coefficient > 0.85) in lobule enrichment values between replicate sets and maximum lobule enrichment > 2 are labelled (Methods, Extended Data Fig. 3a). b, Dot plot of scaled expression of selected gene markers for PC clusters. c, Regional enrichment plots indicating average lobule enrichment for aggregated Aldoc-positive PC subtypes (left) and aggregated Aldoc-negative subtypes (right). Regions labelled as in Fig. 1a. A-Aldoc, anti-Aldoc. d, Regional enrichment plots indicating lobule enrichment for PC clusters. e, Dot plot of scaled expression of selected gene markers for granule cell clusters. f, Regional enrichment plots indicating lobule enrichment for three spatially significant granule cell clusters. g, Dot plot of scaled expression of selected gene markers for Bergman glial clusters. h, Regional enrichment plot indicating lobule enrichment for the Mybpc1-positive Wif1-positive Bergmann glial cluster.

