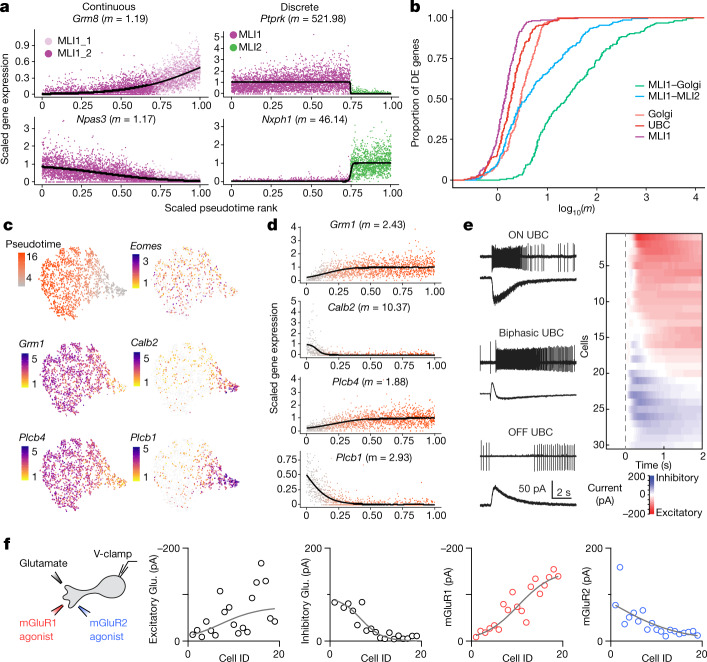
Fig. 3. Cross-cluster continuity among select neuronal populations, including unipolar brush cells.
a, Gene expression ordered by pseudotime (Methods) for two of the top differentially expressed genes between two clusters within the MLI1 type (left, MLI1_1 and MLI1_2), and between two cell types (right, MLI1 and MLI2 cell types). Curves represent logistic fits estimated via nonlinear least squares; maximum slope values (m) are indicated. Differences in magnitude of m values correspond well with visually distinctive molecular continuity versus discreteness. b, Empirical cumulative distributions of log10(m) values (curve fit as in a) for top differentially expressed (DE) genes among aggregated combinations of MLI, Golgi cells and UBC clusters. c, t-distributed stochastic neighbour embedding (t-SNE) visualizations of UBCs (n = 1,613), coloured by pseudotime loading (top left), and log-normalized expression of canonical gene markers for all UBCs (Eomes), ON UBCs (Grm1, Plcb4), and OFF UBCs (Calb2, Plcb1). d, Pseudotime rank ordered gene expression for canonical markers associated with ON UBCs (Grm1, Plcb4) and OFF UBCs (Calb2, Plcb1). Cells are coloured by pseudotime loading. Curves indicate logistic fits estimated as in a; maximum slope values (m) are indicated. e, Left, cell-attached recordings of spiking responses and whole-cell recordings of currents evoked by brief glutamate puffs in ON (top), biphasic (middle) and OFF (bottom) UBCs. Right, heat map of the currents recorded in all UBCs, sorted by the magnitude and time course of charge transfer. f, Left, schematic describing whole-cell recordings obtained from UBCs evoked by pressure application of glutamate (left traces, black), the mGluR1 agonist DHPG (middle trace, red) and the mGluR2 agonist LY354740 (right trace, blue) using three pipettes placed within 20 μm of the recorded cell. Evoked currents from each application are summarized in the correspondingly coloured plots. Representative UBC recordings are shown in Extended Data Fig. 5.

