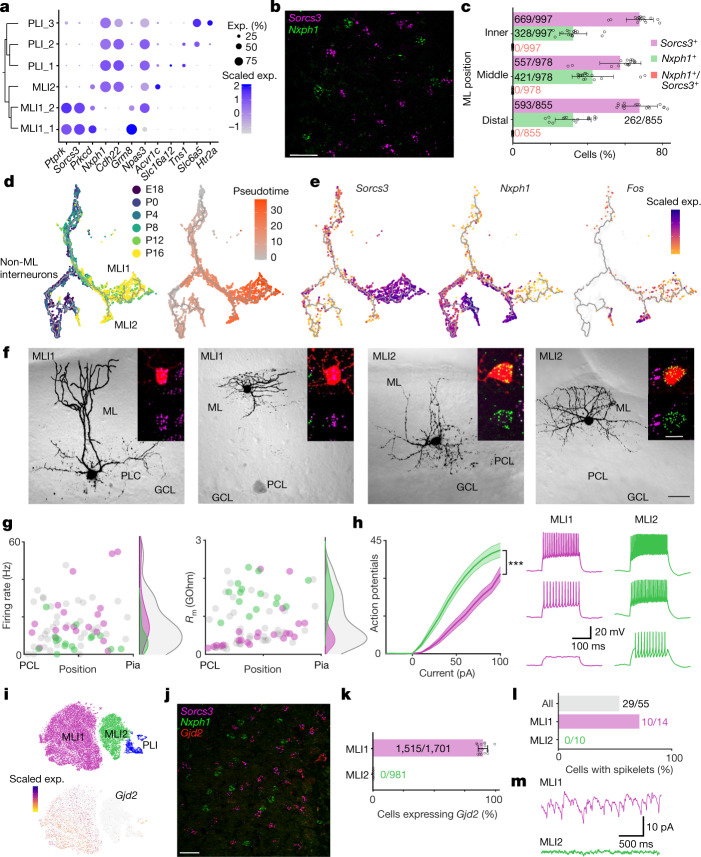
Fig. 4. Two molecularly and electrophysiologically distinct populations of MLIs.
a, Dendrogram of gene expression relationships (computed as in Fig. 1c) among MLI and PLI populations (left), paired with dot plot (right) of selected gene markers. b, Representative image of smFISH expression of Sorcs3 (purple) and Nxph1 (green) within the molecular layer (n = 16 slides sectioned from 3 mice). Scale bar, 20 μm. c, The percentages of Sorcs3+, Nxph1+ and Sorcs3+Nxph1+ cells in the inner third, middle third and distal third of the molecular layer (ML) (total cells counted shown; n = 16 slides sectioned from 3 mice). Data are mean ± s.d. d, UMAP visualization of cerebellar interneuron developmental trajectory, coloured by developmental age of collection (left) and by pseudotime (right) (Methods). e, UMAP visualization of Sorcs3, Nxph1 and Fos expression across MLI development. f, Four two-photon images of representative basket and stellate-like MLI1 and MLI2 neurons in cerebellar slice. Insets show the fluorescent fill of the cell body (red) with the smFISH signals superimposed (top), and the smFISH signal only (bottom; Sorcs3, purple; Nxph1, green). Scale bars, 30 μm (black) and 10 μm (white). n = 23 MLI1 cells, 20 MLI2 cells. g, Scatter plots of firing rate (left) and membrane resistance Rm (right) of molecularly identified MLI1 (purple, n = 23 cells) and MLI2 neurons (green, n = 20 cells), as well as MLIs whose molecular identity was not ascertained (grey, n = 55 cells). Corresponding distributions at the right. h, Left, Mean input–output curves of MLI1 (purple) and MLI2 neurons (green). Shaded area denotes s.e.m. n = 22 MLI1 cells, 20 MLI2 cells. ***P < 0.001, generalized linear mixed effect model (Supplementary Table 3). Right, representative traces of MLI1 (purple) and MLI2 (green) for 20, 40 and 60 pA current injections. i, t-SNE visualization of expression of Gjd2 across MLI and PLI cell types. j, Representative image of smFISH expression of Sorcs3 (purple), Nxph1 (green), and Gjd2 (red), in the molecular layer (n = 16 slides sectioned from 3 mice). Scale bar, 20 μm. k, The percentages of MLI1s and MLI2s expressing Gjd2 in the molecular layer (total cells counted shown; n = 16 slides sectioned from 3 mice). Data are mean ± s.d. l, The percentages of all cells (grey), MLI1s (purple) and ML2s (green) in which spikelets were observed. m, Example voltage clamp recordings in the presence of synaptic blockers show spikelets in MLI1 (purple), but no spikelets in MLI2 (green). Firing rates, Rm values, input–output curves and the numbers of cells with spikelets were all significantly different for MLI1 and MLI2 (Supplementary Table 3).

