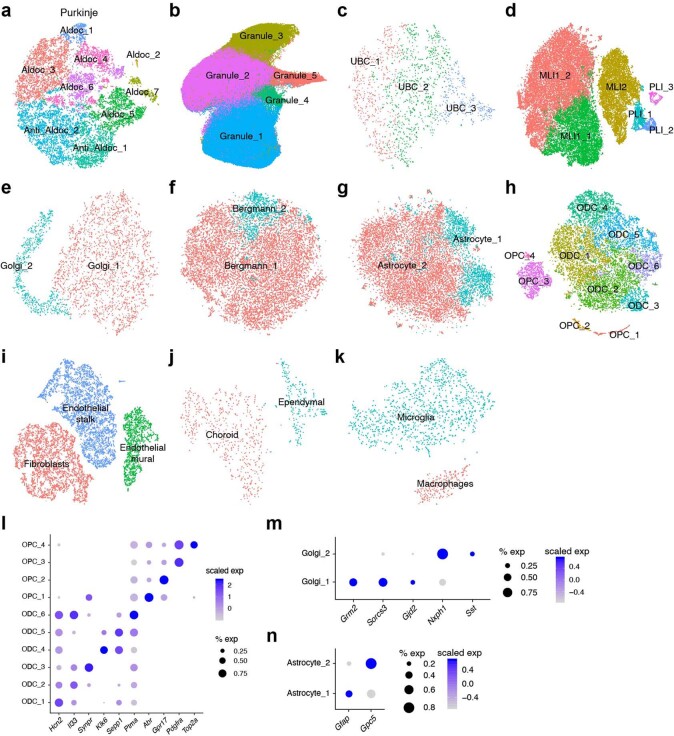
Extended Data Fig. 2. Characterization and annotation of cerebellar subtypes.
a–k, Visualizations of all individual cell type analyses of Purkinje (a), granule (b), UBC (c), MLI or PLI (d), and Golgi (e) neurons, as well as Bergmann (f), astrocyte (g), OPC/ODC (h), endothelial (i), choroid (j), and macrocytic (k) glial populations, labelled by cluster designations. Granule is UMAP, all others t-SNE. l–n, Dot plots of scaled expression of selected marker genes for individual cell type analyses not displayed in the main figures: ODC and OPC (l), Golgi (m) and astrocyte (n).

