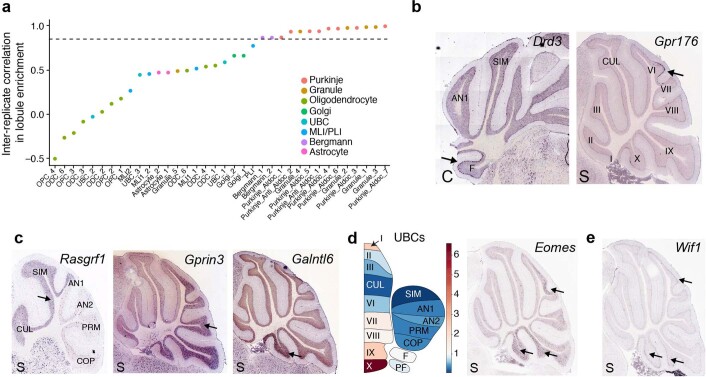
Extended Data Fig. 3. Additional analyses of spatial variation in neuronal and glial subtypes.
a, Scatter plot of inter-replicate correlation (Pearson) for lobule enrichment scores calculated for replicate sets individually, across each cluster (clusters ordered by decreasing correlation). Two replicate sets were designated for each major cluster analysis by aggregating the individuals with the highest representation for each lobule into a single replicate (and similarly for the individuals with second highest representation). High inter-replicate correlation indicates consistent lobule enrichment for subtypes. r = 0.85 is indicated. b, Allen Brain Atlas expression staining for two selected PC markers representing clusters with their respective lobule enrichments indicated; Drd3 in the flocculus (Purkinje_Aldoc_2), and Gpr176 in lobule VI (Purkinje_Aldoc_1). C, coronal section; S, sagittal section. c, Allen Brain Atlas expression staining for three selected GC markers representing clusters with their respective lobule enrichments indicated; Rasgrf1 in the anterior lobules (Granule_1), Gprin3 in the posterior lobules (Granule_2), and Galntl6 in the nodulus (Granule_3). d, Left, lobule enrichment plot indicating enrichment of UBCs in posterior lobules of the cerebellum, particularly lobules IX (uvula) and X (nodulus). Right, Allen Brain Atlas expression staining for UBC marker Eomes, showing enrichment in lobules IX, X and VII. e, Allen Brain Atlas expression staining for Wif1 (a Bergmann_2 cluster marker), indicating expression enriched in lobules VI, X (nodulus), and IX (uvula).

