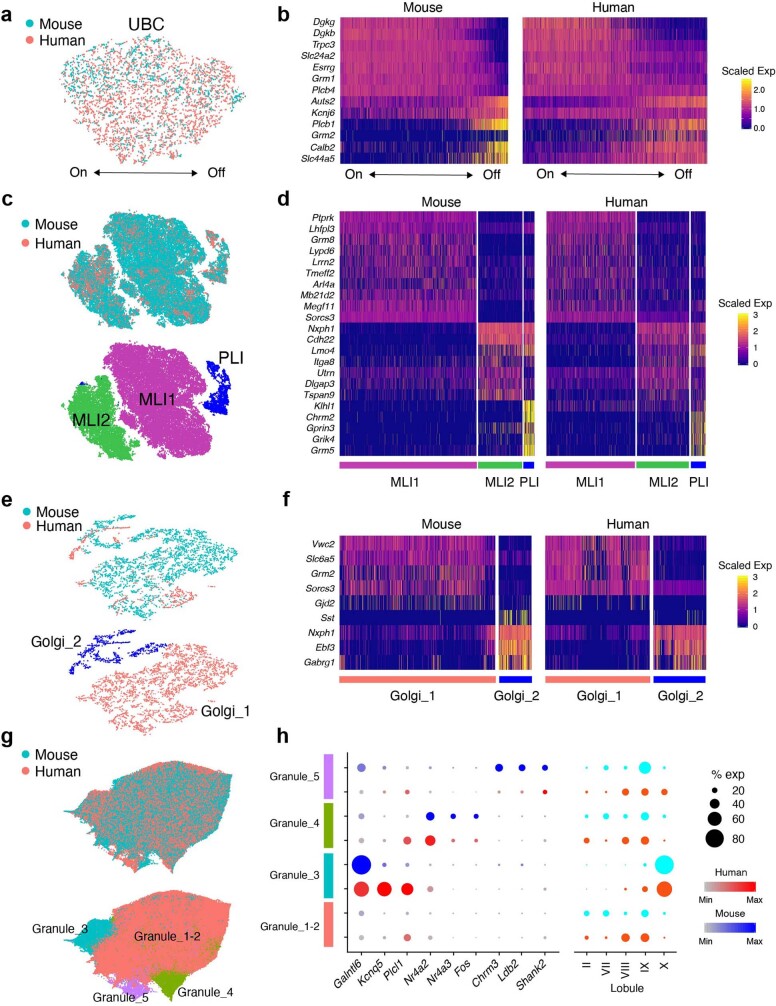
Extended Data Fig. 4. Integrative analysis of human and mouse cerebellar interneuron profiles.
a, c, e, g, UMAP representation of the integrative analyses of UBC (1,613 mouse; 3,893 human) (a), MLI/PLI (45,555 mouse; 14,971 human) (c), Golgi (3,989 mouse; 1,059 human) (e), and granule (119,972 mouse; 130,335 human) (g) cells, coloured by species (top), or joint cluster (bottom, for MLI and PLI, Golgi, and granule only). b, d, f, Heat maps showing expression of selected genes in UBC (b), MLI and PLI (d), and Golgi (f). Profiles are segregated both by species and cluster. UBC profiles are ordered by iNMF factor loadings for factor corresponding to OFF UBCs. h, Left, dot plot showing expression of selected genes in granule clusters, within human (red) and mouse (blue). Right, proportional representation of lobule dissections across the granule clusters. Granule cluster numbers approximately correspond to the mouse-only clusters shown in Fig. 2e.

