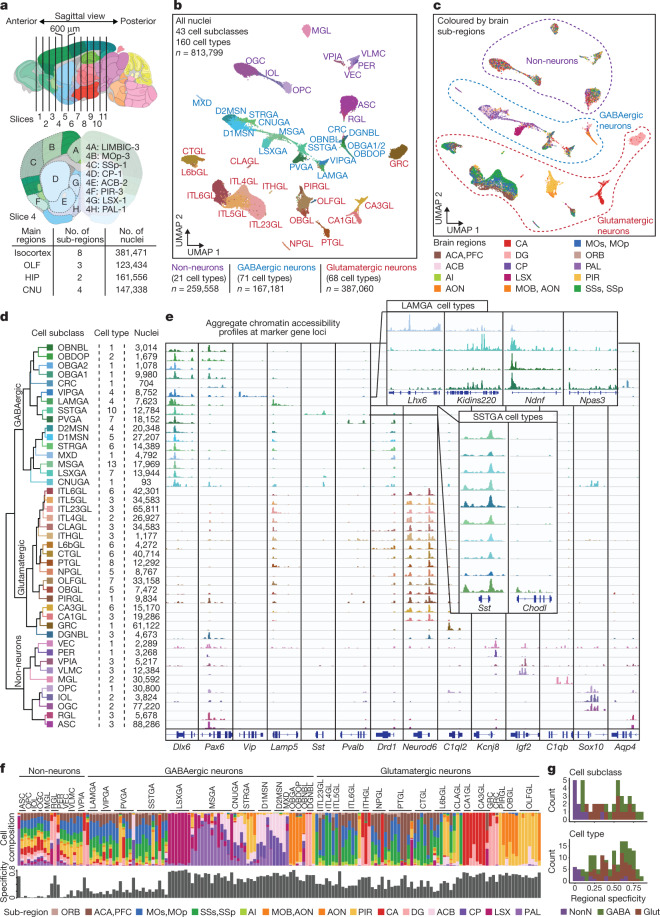
Fig. 1. Single-cell analysis of chromatin accessibility in the adult mouse cerebrum.
a, Schematic of sample dissection strategy. A detailed list of regions is in Supplementary Table 1. b, Uniform manifold approximation and projection (UMAP)58 embedding and clustering analysis of snATAC-seq data. A full list and description of cluster labels are in Supplementary Tables 2, 3. c, UMAP embedding and analysis as in b but coloured by subregions. Dotted lines demark major cell classes. ACA, anterior cingulate area; ACB, nucleus accumbens; AI, agranular insular area; AON, anterior olfactory nucleus; CA, cornus ammonis; CP, caudoputamen; DG, dentate gyrus; LSX, lateral septal nucleus; MOB, main olfactory bulb; MOs, secondary motor area; MOp, primary motor area; ORB, orbital area; PAL, pallidum; PFC, prefrontal cortex; PIR, piriform area; SSs, secondary somatosensory area; SSp, primary somatosensory area. d, Left, hierarchical organization of subclasses on chromatin accessibility. Middle, each subclass represents 1–13 cell types. Right, the number of nuclei in each subclass. e, Genome browser tracks of aggregate chromatin accessibility profiles for each subclass at selected marker gene loci that were used for cell cluster annotation. A full list and description of subclass annotations are in Supplementary Table 4. f, Bar chart representing the relative contribution of subregions to 160 cell types. g, Stacked histograms showing the regional specificity scores of subclasses and cell types of GAGAergic neurons (GABA), glutamatergic neurons (Glu) and non-neurons (NonN).

