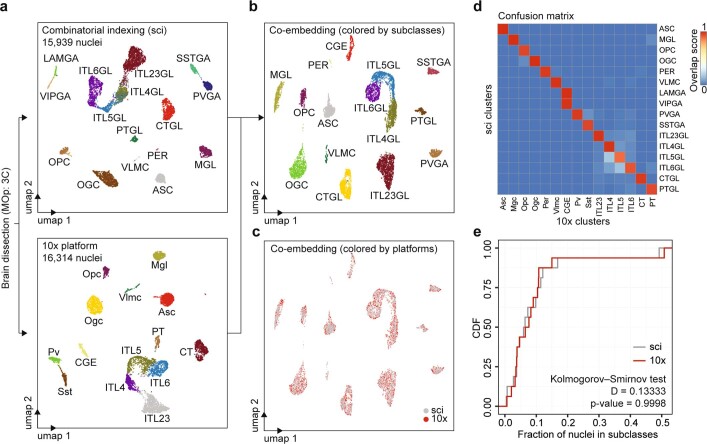
Extended Data Fig. 8. Comparison of cell type compositions in the mouse primary motor cortex determined by snATAC-seq using combinatorial indexing and droplet-based snATAC-seq (10x Genomics) platforms.
a, Individual clustering of snATAC-seq data generated using the single-cell combinatorial indexing (sci) and the droplet-based barcoding (10x) for the primary motor cortex (dissection: 3C). b, c, Co-embedding and joint clustering of snATAC-seq data generated from sci and 10x platforms. b, Dots are coloured by cell clusters. c, Dots are coloured by the experimental platforms (sci or 10x). d, Heat map illustrating the overlap between cell cluster annotations from both platforms. Rows show cell types from combinatorial barcoding; columns show cell types from the droplet-based platform. The overlap between the original clusters and the joint cluster was calculated (overlap score) and plotted on the heat map. e, CDF plot showing the fraction of nuclei in individual cell types for each platform.

