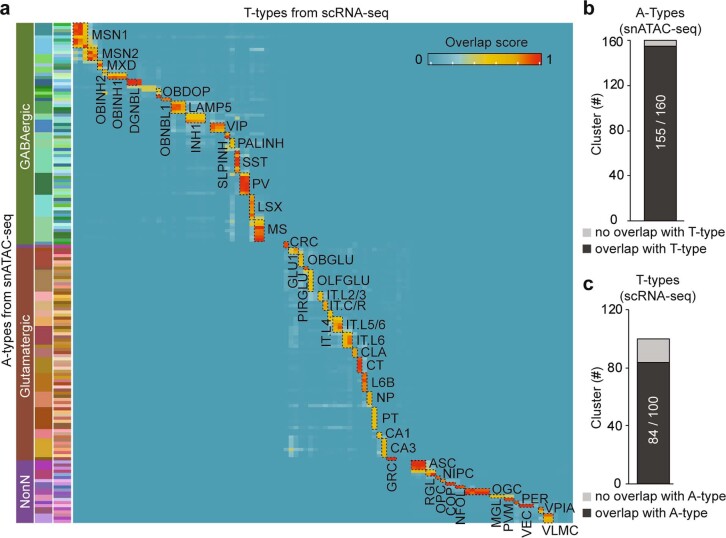
Extended Data Fig. 10. The chromatin-accessibility-based cell clustering matches transcriptomics-based cell taxonomy.
a, Heat map showing the similarity between A-type (accessibility) and T-type (transcriptomics) based cell cluster annotations. Each row represents an A-type cluster (a total of 160) and each column represents a T-type cluster (a total of 100). Similarity between original clusters and the joint cluster was calculated as the overlap score, which defined as the sum of minimal proportion of cells/nuclei in each cluster that overlapped within each co-embedding cluster. The overlap score varied from 0 to 1 and was plotted on the heatmap. Joint clusters with an overlap score of >0.5 are highlighted using black dashed line and labelled with RNA–ATAC joint cluster ID. For a full list of cell type labels and descriptions see Supplementary Table 4. b, c, Bar plots indicating the number of clusters that matched (dark grey) or did not match (light grey) clusters from the other modality. b, 155 out of 160 A-types had a matching T-type cluster. c, 84 out of 100 T-types had a matching A-type cluster.

