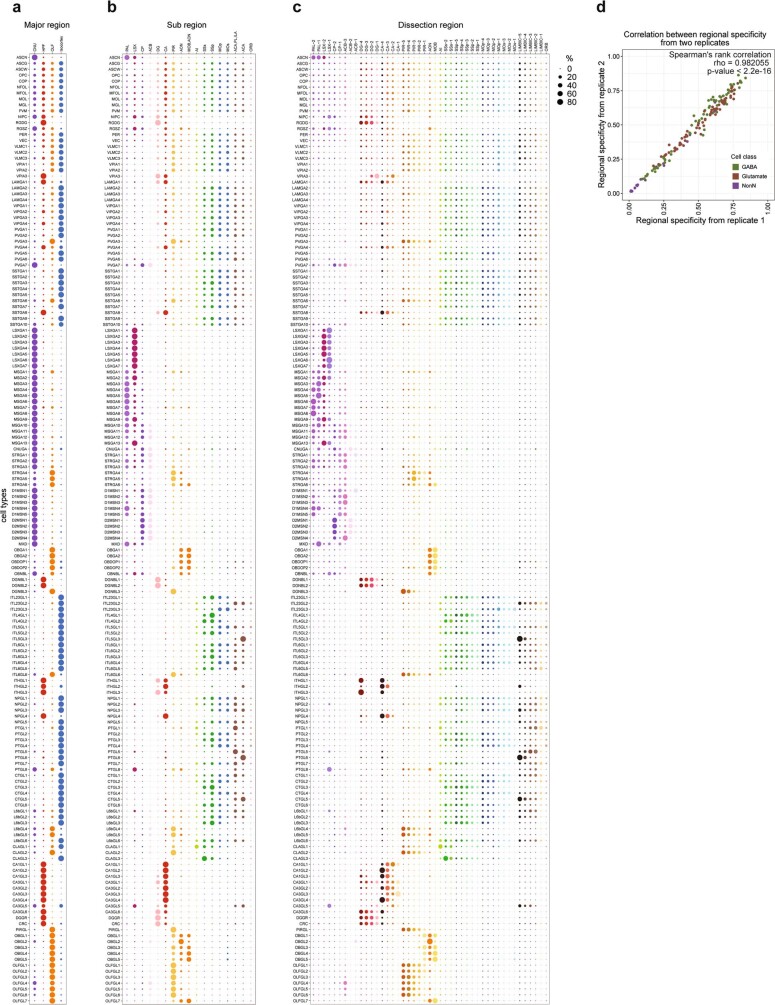
Extended Data Fig. 12. Distribution of each cerebral cell type across different brain regions, subregions and anatomical dissections.
a–c, Normalized percentages of cells from each major brain region (a), subregion (b) and dissection (c) are shown as dots in cell types, with the sizes of the dots reflecting the percentages. d, Scatter plot showing the reproducibility of regional specificity of each cell type between two biological replicates of brain dissections.

