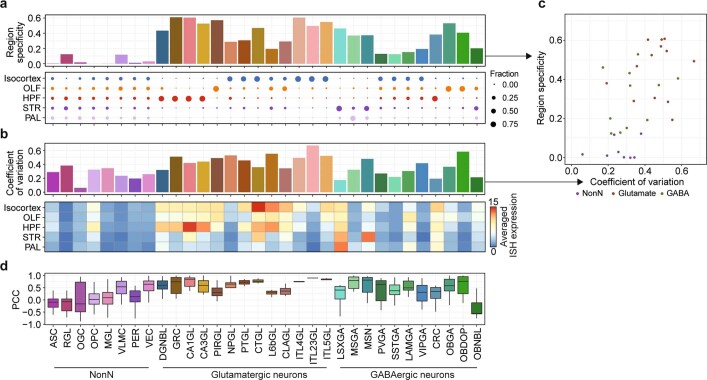
Extended Data Fig. 13. The regional specificity of cerebral cell types defined on the basis of snATAC-seq datasets is consistent with ISH patterns of cell-type-specific genes in the mouse brain.
a, Bar plots showing regional specificity of each cell type determined from relative contribution from five different brain regions, including isocortex, olfactory areas, hippocampal formation, striatum and pallidum. Dot plots showing percentages of each major brain region in the subclass of cerebral cells. The size of each dot reflects the relative contribution of the brain region as indicated by the legend to the right of the panel, and the colour of the dots indicates the brain region. b, Bar plots showing the coefficients of variation calculated with the average normalized ISH signals of cell-type-specific marker genes for the corresponding cell subclasses across five brain regions. The heat map shows the average normalized ISH signals of cell subclass-specific marker genes. The cell subclass-specific marker genes were identified for joint cell subclasses from RNA-ATAC integrative analysis (Extended Data Fig. 9). For a full list of ISH data of cell subclass-specific genes, see Supplementary Table 6. c, Scatter plot shows the correlation between the coefficients of variation of marker gene ISH signals and the regional specificity score calculated based on snATAC-seq data for 32 joint cell subclasses from RNA-ATAC integration analysis (Pearson correlation coefficients (PCC) = 0.55). d, Box plots show the Pearson correlation coefficients (PCC) calculated between cell composition across brain regions based on snATAC-seq data and the spatial distribution ISH signals of cell subclass-specific genes across the five main brain regions for each major brain cell subclass. Box plots are stylized as in Fig. 2c.

