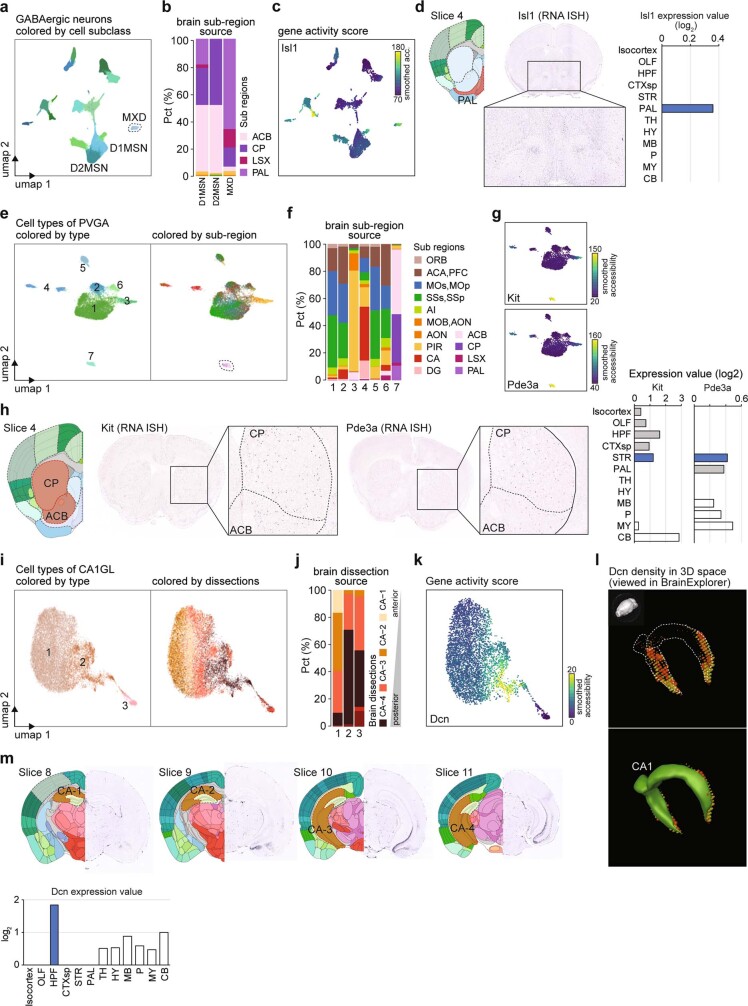
Extended Data Fig. 14. Brain region specificity of different subclasses and cell-types.
a, UMAP58 embedding of the subclasses of GABAergic neurons. b, Sub-region composition of dopaminergic neurons, D1MSN and D2MSN, and MXD illustrates most MXD neurons were detected in the pallidum. c, Gene activity score for gene Isl1 in GABAergic neurons predicts expression in MXD. d, RNA ISH and bar plot illustration of expression levels show the highest abundance of Isl1 in the predicted region, pallidum (blue). Data and images were downloaded from © 2004 Allen Institute for Brain Science. Allen Mouse Brain Atlas. Available from: atlas.brain-map.org. e, UMAP58 embedding of PVGA cell types. f, Sub-region composition for each PVGA cell type illustrates that majority of PVGA-7 were detected in nucleus accumbens and caudoputamen. g, Gene activity scores for Kit and Pde3a predict expression in one PVGA cell type (PVGA-7). h, RNA ISH and bar plot illustration of expression levels show expression of Kit and Pde3a in predicted regions, nucleus accumbens and caudoputamen. Predicted region in blue, other sampled regions in grey and non-sampled regions in white. i, UMAP58 embedding of CA1 glutamatergic neurons (CA1GL) cell types. j, Dissection composition in each CA1GL cell type. k, Gene activity of gene Dcn in CA1GL cell types. l, Density of expression level of Dcn viewed in BrainExplorer (https://mouse.brain-map.org/static/brainexplorer) shows expression cornu ammonis field 1 (CA1). m, RNA ISH and bar plot show highest expression of Dcn CA1 and hippocampal formation. The predicted region is coloured in blue, other sampled regions in grey and non-sampled regions in white.

