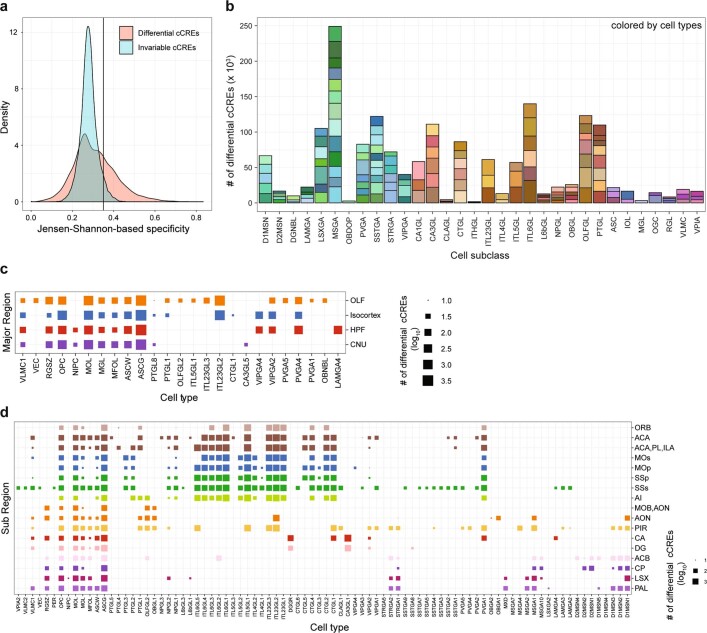
Extended Data Fig. 16. Differentially accessible cCREs across different cell types and brain regions.
a, Distribution plot of the Jensen–Shannon specificity scores of the differentially accessible cCREs and invariable cCREs. The vertical line shows the cutoff at FDR of 0.05. b, Stacked bar charts showing the number of differential cCREs between cell types for subclasses. c, A graph shows the numbers of differential cCREs in each major brain region. d, A graph shows the numbers of differential cCREs across subregions. The sizes of dots correspond to the number of differential cCREs (log10-transformed) found in each cell type between brain regions, and the colours of the dots indicate the major brain regions in c, subregions in d.

