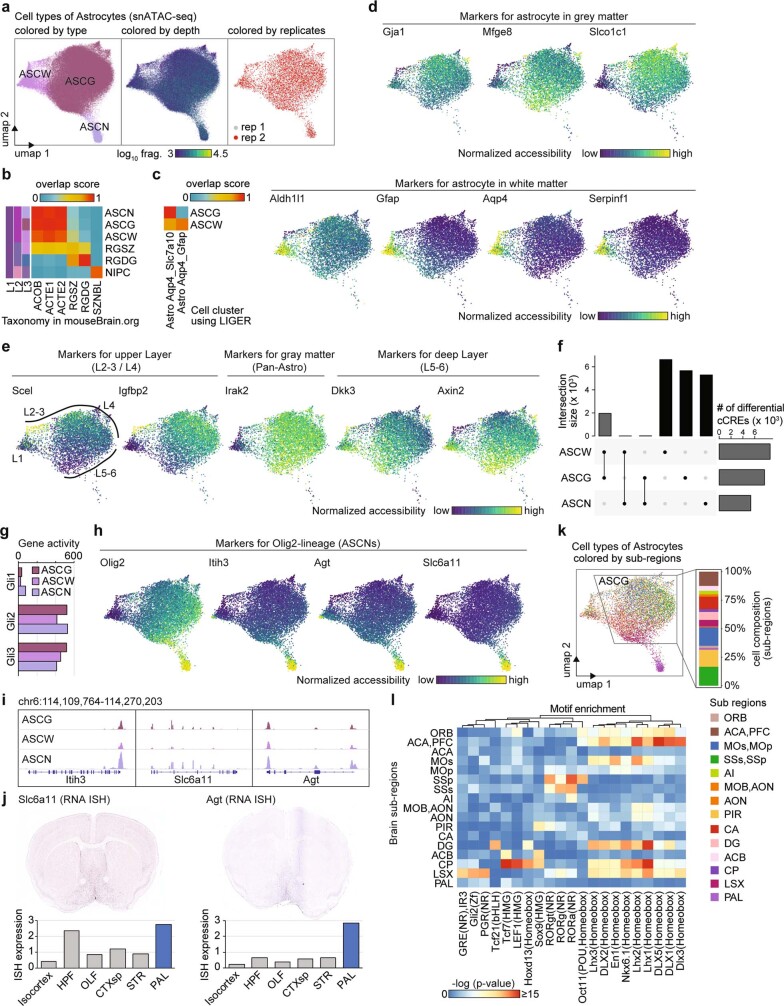
Extended Data Fig. 18. Astrocyte cell types exhibit regional specificity and differential chromatin accessibility.
a, UMAP58 embedding of astrocytes, coloured by cell type (left), fragment depth (middle), and replicate (right). b, Heat map illustrating the overlap between A-type and T-type cell cluster annotations. Each row represents a snATAC-seq subtype and each column represents scRNA-seq cluster2 (http://mousebrain.org). The overlap between original clusters and the joint cluster was calculated (overlap score) and plotted on the heat map. c, Heat map showing overlap score with cell type defined by integration of multiple transcriptomic and epigenomic modalities63. d, Smoothed gene activity scores of marker genes for astrocytes from white and grey matter. e, Smoothed gene activity scores of representative cortical layer-specific marker genes for astrocyte. f, Upset plot showing intersections of differentially accessible cCREs between cell types. cCREs only presented in one cell type are defined as cell-type-specific cCREs. g, Gene activity score for GLI transcription factor family members in astrocyte cell types. h, Smoothed gene activity scores of Oligo2, Itih3, Agt and Slc6a11 in astrocytes show stronger activity in ASCN. i, Genome browser tracks60 of aggregate chromatin accessibility profiles for each astrocyte cell type at gene Itih3, Slc6a11 and Agt locus. j, Views of ISH experiments from Allen Brain Atlas (atlas.brain-map.org) showing predominant expression of Slc6a11 and Agt in the pallidum. Bar plot showing expression values from ISH experiments in brain structures. Data and images were downloaded from © 2004 Allen Institute for Brain Science44. Allen Mouse Brain Atlas. Available from: atlas.brain-map.org. k, UMAP embedding of astrocyte coloured by brain subregions. l, Motif enrichment in cCREs in ASCG with regional specificity.

