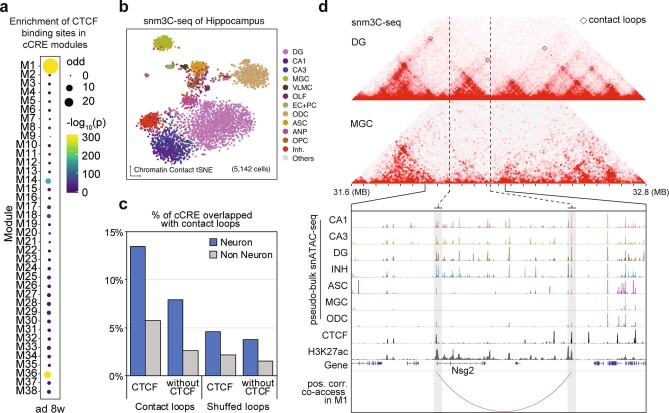
Extended Data Fig. 20. CTCF-associated cCRE–gene pairs.
a, Enrichment of CTCF binding sites from 8-week-old mouse forebrain31 in cCRE modules. b, t-SNE of sn-m3C-seq cells (n = 5,142) coloured by clusters. This panel was replicated from the accompanying paper29 for illustration purposes. c, Percentage of cCRE from module M1 with and without CTCF binding overlapping with contact loops identified from snm3C-seq in hippocampus29. Shuffled loops are generated by randomly flipping one of the anchors. d, Genome browser track60 view at the Nsg2 locus as an example for CTCF dependent loops. Displayed are chromatin accessibility profiles for several neuronal and non-neuronal clusters, positively correlated cCRE–gene pairs, H3K27ac in postnatal day 0 (P0) mouse forebrain108 and CTCF from in cortex from 8-week-old mouse31. The triangle heat map (top) shows chromatin contacts in DG neurons and MGC derived from snm3C-seq data (see accompanying manuscript29). DG-specific loops are highlighted by boxes.

