
Fig. 3. Regional specificity of cell types correlates with chromatin accessibility at cCREs.
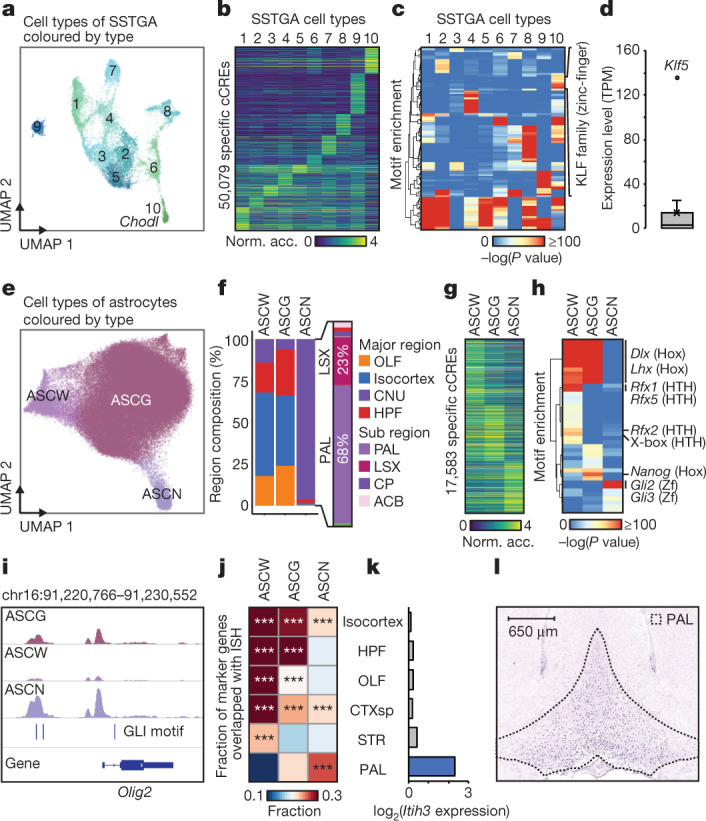
a UMAP58 embedding of SSTGA cell types. b, Normalized chromatin accessibility of 50,079 cell-type-specific cCREs. c, Motif enrichment analysis for cell-type-specific cCREs. d, Expression level of genes encoding members of the KLF transcription factor family in SSTGA10. Expression values of Sst-Chodl cells were extracted from the Allen Brain Atlas (atlas.brain-map.org)44. e, UMAP58 embedding of astrocyte cell types. f, Contribution of brain regions to each astrocyte cell type. CNU, cerebral nuclei; OLF, olfactory area; HPF, hippocampus. g, Normalized accessibility of astrocyte cell-type-specific cCREs. h, Motif enrichment in astrocyte cell-type-specific cCREs. Hox, homeobox; HTH, helix-turn-helix; Zf, zinc-finger. i, Genome browser view60 showing ASCN-specific cCREs at the Olig2 locus. j, Heat map showing the fraction of overlap between spatially mapped genes from ISH in different brain structures and genes specific to astrocyte cell types. ***P < 0.0001, Fisher’s exact test. k, Bar plot showing log2-transformed expression value of Itih3 in each brain region from ISH experiments. CTXsp, cortical subplate. Images downloaded from © 2004 Allen Institute for Brain Science. Allen Mouse Brain Atlas. Available from: atlas.brain-map.org. l, Views of ISH experiment from the Allen Brain Atlas, showing spatial expression of Itih3 in the pallidum.