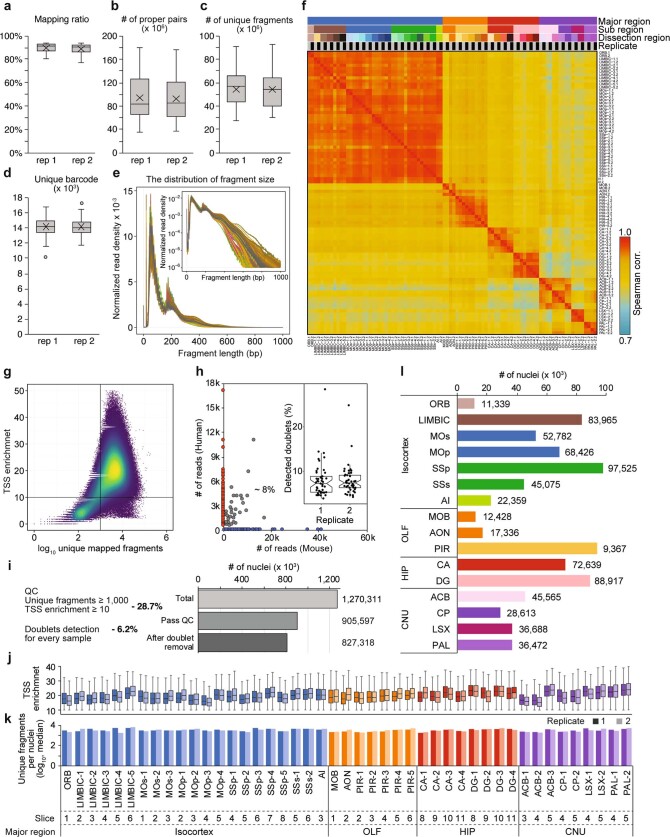
Extended Data Fig. 2. Quality control metrics of the snATAC-seq datasets.
a, Box plots showing the distribution of mapping ratios (the fraction of the mapped sequencing reads) in replicates (rep) 1 and 2 of snATAC-seq experiments from each brain dissection. b, Box plots showing the distribution of the number of proper read pairs (reads are correctly oriented) in replicates 1 and 2 of snATAC-seq experiments. c, Box plots showing the distribution of numbers of unique chromatin fragments detected in replicates 1 and 2 of snATAC-seq experiments. d, Box plots showing the distribution of number of unique barcodes captured in replicates 1 and 2 of snATAC-seq experiments. e, Frequency distribution plot showing the fragment size distribution of each snATAC-seq dataset. f, Heat map showing the pairwise Spearman correlation coefficients between snATAC-seq datasets. The column and row names consist of two parts: brain region name and replicate label. g, Dot plot illustrating fragments per nucleus and individual TSS enrichment. Nuclei in top right quadrant were selected for analysis (TSS enrichment > 10 and > 1,000 fragments per nucleus). h, Fraction of cell collision estimated from species mix samples. Inset shows the fraction of potential barcode collisions detected in snATAC-seq libraries using a modified version of Scrublet66. i, Number of nuclei retained after each step of quality control. j, Distribution of TSS enrichment. k, The number of uniquely mapped fragments per nucleus for individual libraries. l, The number of nuclei passing quality control for subregions. All box plots are stylized as in Fig. 2c.

