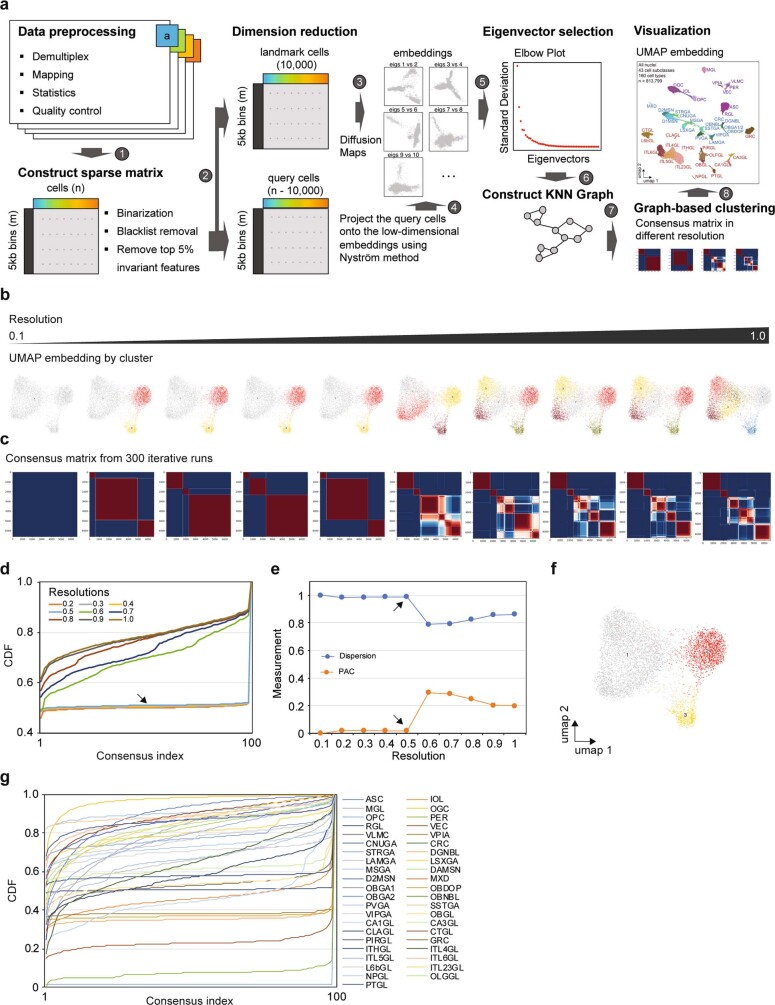
Extended Data Fig. 3. Cell clustering based on snATAC-seq data.
a, Schematic diagram of the cell clustering pipeline. b, UMAP58 embedding of a representative cell clustering at different resolutions from 0.1 to 1.0 using Leiden algorithm. c, Consensus matrix from 300 iterative clustering runs with different resolutions. d, Cluster stability at different resolutions was assessed using a CDF of consensus matrices. High values illustrate nuclei that clustered together in most cases. e, The PAC and dispersion coefficient at different resolutions. A low PAC and high dispersion coefficient indicates the best and most stable clustering. f, Optimal cell clustering result for a representative subclass (resolution = 0.5). g, The CDF curve of consensus matrix at an optimal resolution for every subclass.

