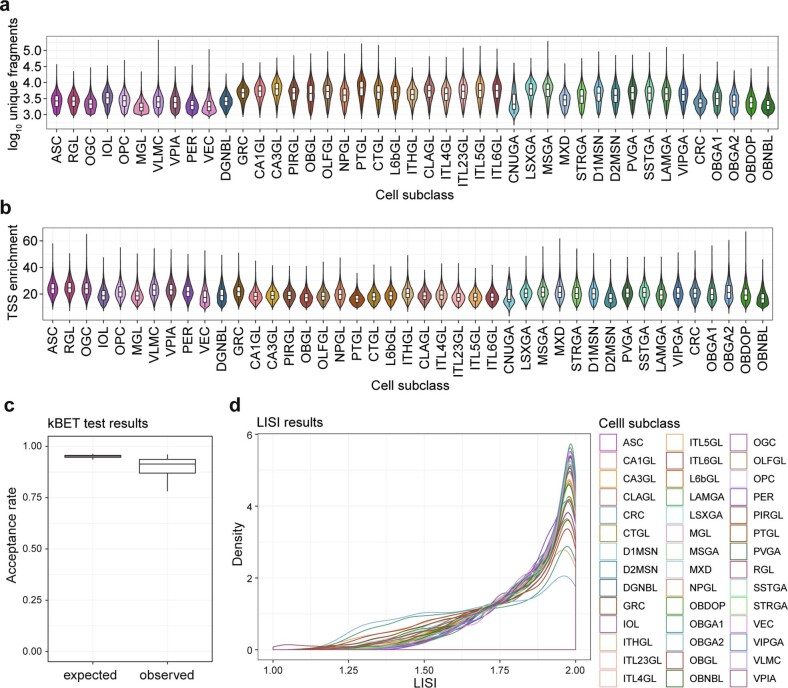
Extended Data Fig. 4. Summary statistics of snATAC-seq datasets in the current study.
a, Violin plots showing the log-transformed number of unique fragments per nucleus in each cell subclass identified. b, Violin plots showing the TSS enrichment in each nucleus of each subclass. c, Acceptance rate from k-nearest neighbour batch effect test (kBET)106 for each subclass of cerebral cells. d, Distribution of the local inverse Simpson’s index (LISI) scores107 for cells in each subclass.

