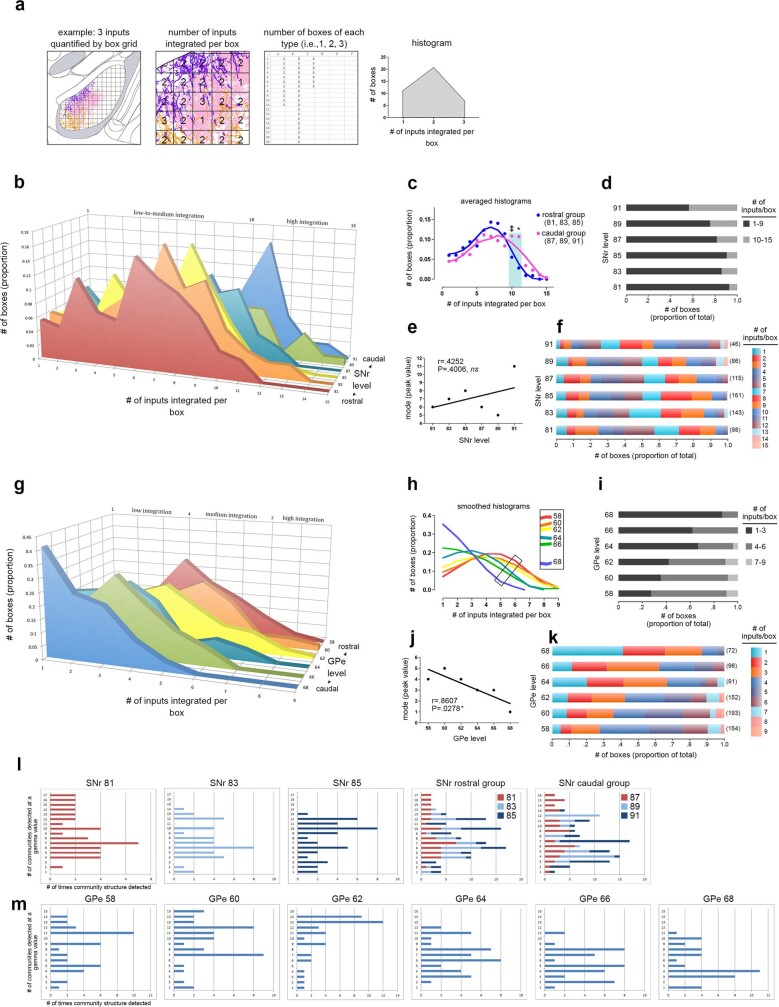
Extended Data Fig. 12. Box grid quantification of striatal output data.
Box grid data quantifies striatonigral and striatopallidal topography, describes integration trends in the pallidum and nigra, and serves as input data for the community analysis. The example in a, illustrates how the box grid analysis works using 3 inputs (pink, purple, and orange; left panel). Each whole and partial box in the ROI receives 1-3 inputs (center panel); the number of boxes of each input category is tallied (right panel) and plotted in a frequency distribution (histogram). b, Frequency distributions for each level of the SNr are shown rostral to caudal (front to back in the graph). The caudal 3 levels have a greater proportion of boxes devoted to integrating high numbers of inputs, as seen by the tails of their distributions sticking out in that range. This was validated statistically by comparing the caudal 3 and the rostral 3 distributions with ANOVA (* P<.0033, ‡ .05>P>.025), which are averaged and summarized in c. The proportion of boxes integrating various numbers of inputs at each level is represented in the stacked bar charts: d, shows a categorized graph, with low-to-moderate integration (1-9 inputs) in black and high integration (10-15 inputs) in gray; f, shows the same data with each bin in a different color (the bars from left to right correspond to the legend from top to bottom), and the numbers in parentheses at the end of each bar are the total number of boxes at each level. e, Regression analysis of the peak of each histogram from b with SNr level shows no correlation (r = 0.4252, P = 0.4006). g, Frequency distributions for each level of GPe are shown caudal to rostral (front to back in the graph). The distributions are fairly similar in shape and exhibit a linear trend, from rostral GPe integrating higher numbers of inputs per box and shifting to successively lower integration with each caudal level. Smoothing of the histograms and plotting them in a single plane in h highlights this stepwise trend from higher to lower integration, rostral to caudal, respectively (inset). j, This trend was found to be significant when assessed by regression analysis (r = 0.8607, P = 0.0278). Stacked bar graphs in i and k are as in d and f. l-m, The Louvain community detection algorithm was run multiple times over a range of gamma values, with gamma modulating the number of communities (i.e., domains) detected in the nigra or pallidum. The bar graphs show the different community structures detected (y axis) and how many times they were detected (x axis); each integral increment on the x axis means one gamma detected that community structure, so the peaks represent the most commonly detected community structures. These survey analyses were run for each nucleus-level, and results for SNr 81–85 can be seen individually and stacked together (SNr rostral group), along with the stacked graph for the SNr caudal group (SNr 87–91, individual graphs not shown). The individual graphs for GPe are shown in m.

