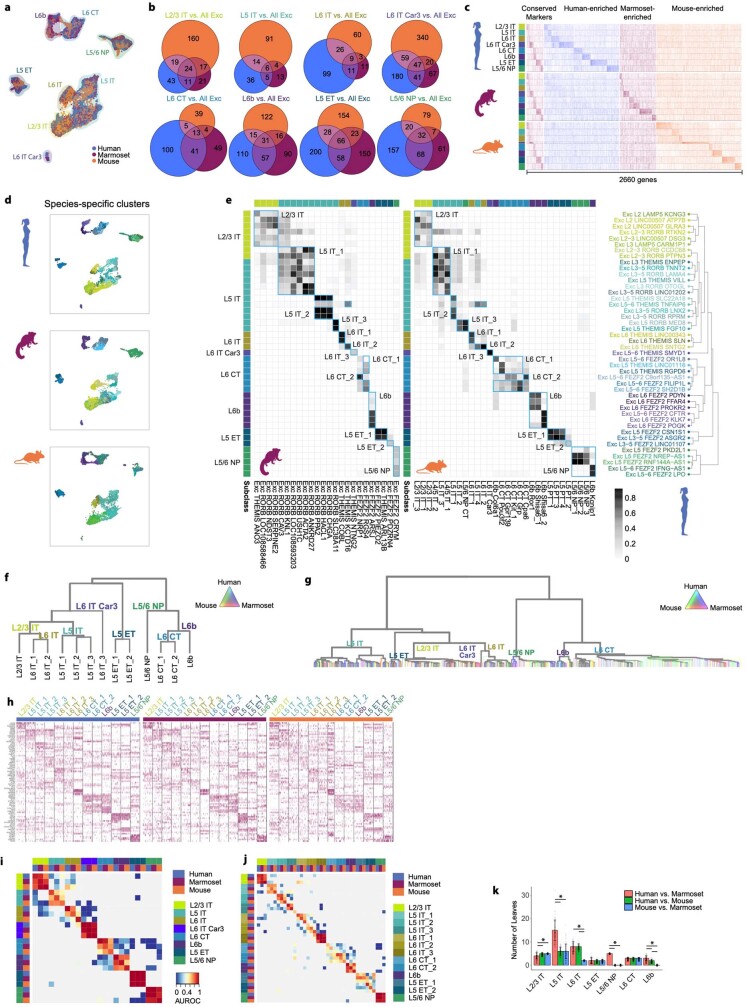
Extended Data Fig. 4. Homology of glutamatergic neurons across species.
a, UMAP visualization of integrated snRNA-seq data from human, marmoset and mouse glutamatergic neurons. The highlighted colours indicate subclasses. b, Venn diagrams indicating the number of DEGs shared across species by subclass. DEGs were determined by ROC tests of a subclass against all other glutamatergic subclasses within a species. c, Heat map of conserved and species-enriched DEGs from b, ordered by subclass and species enrichment. The heat map shows expression, scaled by column, for up to 50 randomly sampled nuclei from each subclass for each species. d, UMAP visualization of integrated snRNA-seq data, with projected nuclei split by species. Colours indicate different within-species clusters. e, Cluster overlap heat map showing the proportion of nuclei in each pair of species clusters that are mixed in the cross-species integrated space. Cross-species consensus clusters are indicated by labelled blue boxes. The top and left axes indicate the subclass of a given within-species cluster by colour. The bottom axis indicates marmoset (left) and mouse (right) within-species clusters. The right axis shows the glutamatergic branch of the human dendrogram from Fig. 1a. f, Dendrogram showing cross-species clusters of glutamatergic neurons, with branches coloured by species mixture (grey, well mixed). g, Unpruned dendrogram of clusters of glutamatergic neurons, from unsupervised clustering of integrated RNA-seq data. The branch thickness indicates the relative number of nuclei, and the branch colour indicates species mixing. Major branches are labelled by subclass. h, Heat maps showing scaled expression of marker genes for each glutamatergic cross-species cluster. The top five marker genes for each cross-species cluster are shown, with an additional five genes for L5 extratelencephalic, L5 intratelencephalic and L6 intratelencephalic neurons. Initial genes were identified by performing a Wilcox test of every integrated cluster against all other glutamatergic nuclei. Additional DEGs were identified for L5 extratelencephalic, L5 intratelencephalic and L6 intratelencephalic cross-species clusters, by comparing one of the cross-species clusters with all other related nuclei (for example, L5 IT_1 against all other L5 IT neurons). i, j, Heat map of ‘one versus best MetaNeighbour’ scores for glutamatergic subclasses (i) and clusters (j). k, Bar plots quantifying the number of well mixed leaf nodes (mean ± s.d.; n = 100 subsamples) from unsupervised clustering of pairwise species integrations. ANOVA tests for each subclass were followed by two-sided Tukey’s HSD tests with Bonferroni correction for multiple comparisons; *P < 0.005.

