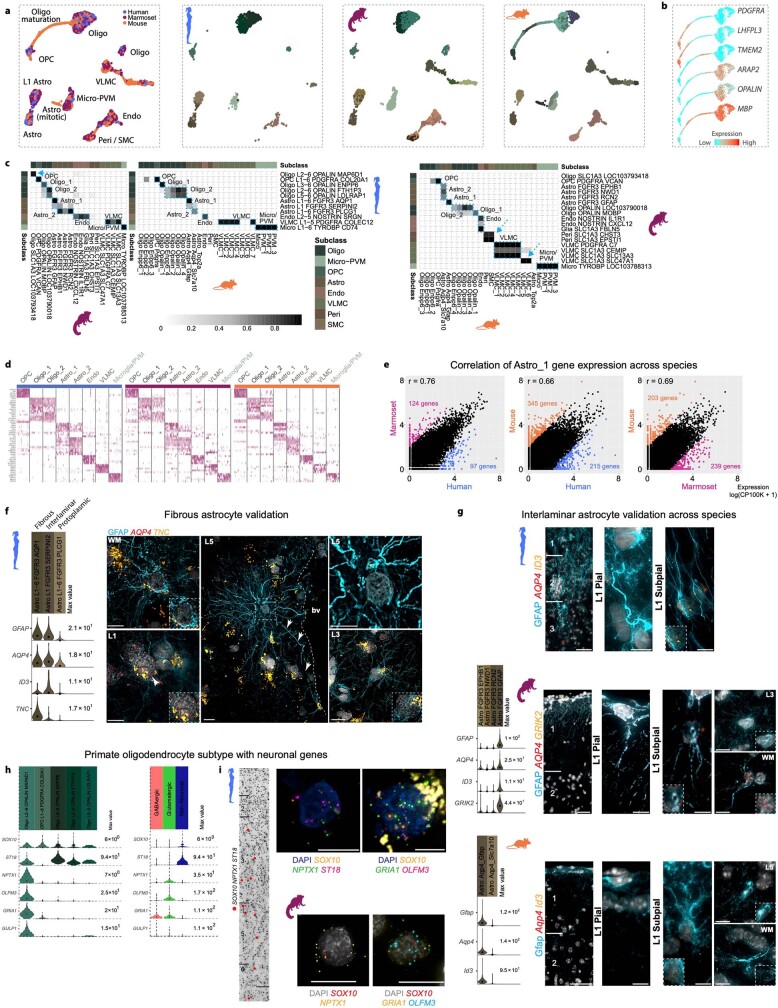
Extended Data Fig. 5. Homology of non-neuronal cell types across species.
a, UMAP plots of integrated RNA-seq data for non-neuronal nuclei, coloured by species and within-species clusters. Note that some cell types are present in only one or two species. b, UMAP plot showing maturation lineage between oligodendrocyte precursor cells (OPCs) and oligodendrocytes on the basis of reported marker genes93; this lineage was present in mice but not primates, probably reflecting the younger age of mouse tissues used. c, Heat maps showing the proportion of nuclei in each species-specific cluster that overlap in the integrated clusters. Blue boxes define homologous cell types that can be resolved across all three species. Arrows highlight clusters that overlap between two species and are not detected in the third species, owing to differences in the sampling depth of non-neuronal cells, the relative abundances of cell types between species, or evolutionary divergence. Pericytes, smooth muscle cells (SMCs) and some subtypes of vascular and leptomeningeal cells (VLMCs) were present in marmoset and mouse and not human datasets, although these cells are present in human cortex94. Mitotic astrocytes (Astro_Top2a) were present in mice only, and represented 0.1% of non-neuronal cells. d, Conserved marker genes from homologous cell types across species. e, Pairwise comparisons between species of log-transformed gene expression (counts per 100,000 transcripts) of the Astro_1 type. Coloured points correspond to significantly differentially expressed genes (FDR less than 0.01; log-transformed fold change greater than 2). r, Spearman correlation. f, Validation of fibrous astrocytes in situ. Violin plots show marker genes from clusters of human astrocytes that correspond to fibrous, interlaminar and protoplasmic types on the basis of in situ labelling of types. Left ISH images show fibrous astrocytes located in the white matter (WM, top), and a subset of L1 astrocytes (bottom) that express the Astro L1-6 FGFR3 AQP1 marker gene TNC. The centre ISH image shows a putative varicose projection astrocyte located in cortical L5 adjacent to a blood vessel (bv) and extending long processes labelled with glial fibrillary acidic protein (GFAP; white arrows); this astrocyte does not express the marker gene TNC. The white dashed box indicates the area shown at higher magnification in the top right panel. Likewise, the L3 protoplasmic astrocyte shown in the bottom right panel does not express TNC. Scale bars, 15 μm. g, Combined GFAP immunohistochemistry and RNAscope FISH for markers of L1 astrocytes in humans, mice and marmosets. In humans (top panels), pial and subpial interlaminar astrocytes are labelled with AQP4 and ID3 and extend long processes from L1 down to L3. In marmosets (centre panels), both pial and subpial L1 astrocytes express AQP4 and GRIK2 and extend GFAP-labelled processes through L1 that terminate before reaching L2. An image of a marmoset protoplasmic astrocyte located in L3 (top right) shows that this astrocyte type does not express the marker gene GRIK2. A subset of marmoset fibrous astrocytes located in the white matter (bottom right) express GRIK2, suggesting that fibrous and L1 astrocytes have a shared gene-expression signature, as also seen in humans3. L1 astrocytes in mice (bottom panels) consist of pial and subpial types that differ morphologically but are characterized by their expression of the genes Aqp4 and Id3. Pial astrocytes in mice extend short GFAP-labelled processes that terminate within L1, whereas subpial astrocytes appear to extend processes predominantly towards the pial surface. Protoplasmic astrocytes (an example is shown in L5) do not express Id3, whereas fibrous astrocytes share expression of Id3 with L1 astrocyte types. In each image, a higher magnification of the cell is shown in white dashed boxes to demonstrate RNAscope spots for each gene labelled. Scale bars, 20 μm. h, Violin plots showing marker genes from clusters of oligodendrocyte lineages in humans. Transcripts detected in the Oligo L2−6 OPALIN MAP6D1 cluster include genes that are expressed almost exclusively in neuronal cells. i, Left, Inverted DAPI image showing a column of cortex labelled with markers of the human Oligo L2-6 OPALIN MAP6D1 type. Red dots show cells triple labelled for SOX10, NPTX1 and ST18. Top right, examples of cells labelled with combinations of marker genes specific for the human Oligo L2-6 OPALIN MAP6D1 type. Bottom right, example of a marmoset cell labelled with the marker genes OLIG2 and NRXN3. Scale bars, 20 μm.

