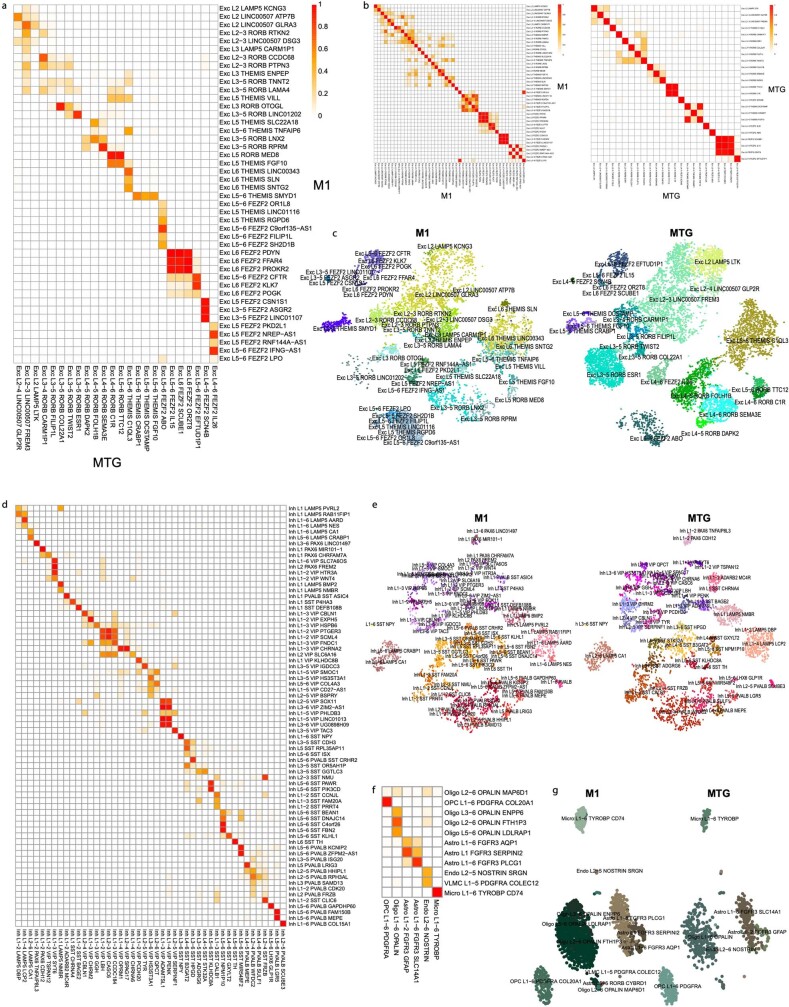
Extended Data Fig. 10. Homologies of cell types in human cortical areas based on RNA-seq integration.
a, Heat map showing the overlap of clusters of glutamatergic neurons between M1 and MTG. Interestingly, four MTG L2/3 intratelencephalic types (LTK, GLP2R, FREM3 and CARM1P1) with distinct physiology and morphology23 had less clear homology in M1, indicating more areal variation in supragranular neurons. b, Heat maps showing the overlap of clusters of glutamatergic neurons for M1 and MTG test datasets. Clusters were split in half, and the two datasets were integrated using the same analysis pipeline as for the M1 and MTG integration. Most clusters mapped correctly (along the diagonal) with some loss in resolution between closely related clusters (red blocks). c, t-SNE plots of integrated glutamatergic neurons labelled with M1 and MTG clusters. d–g, Heat maps of cluster overlaps and t-SNE plots of integrations for GABAergic neurons (d, e) and non-neuronal cells (f, g), as described in a–c for glutamatergic neurons.

