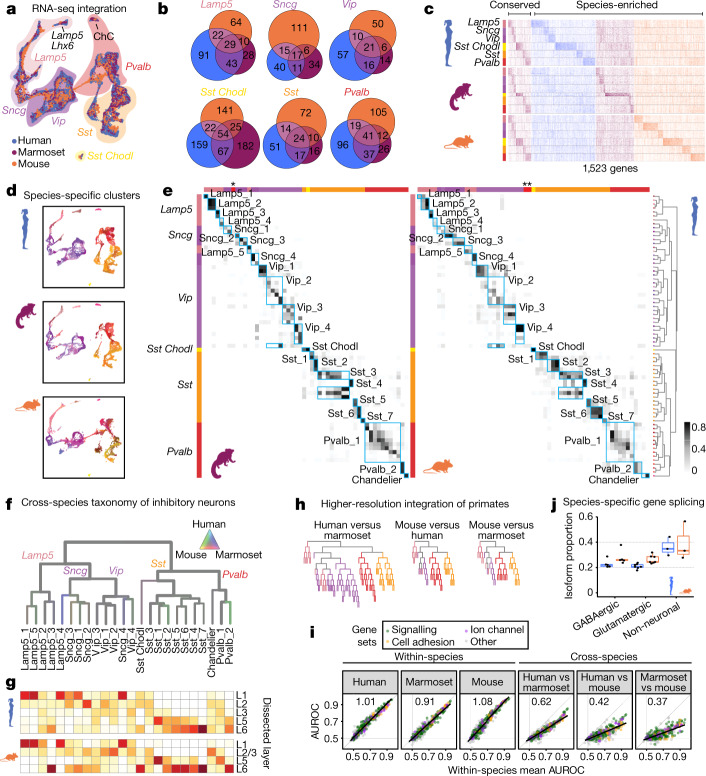
Fig. 2. Homology of GABAergic neurons across species.
a, Uniform manifold approximation and projection (UMAP) dimensional reduction of integrated snRNA-seq data. b, Venn diagrams showing subclass DEGs shared across species. c, Heat map showing expression of conserved and species-enriched DEGs. d, UMAP from a, separated by species and coloured by within-species clusters. e, Proportion of nuclei that overlap between human (rows, ordered as in Fig. 1a) and marmoset or mouse clusters in the integrated space. Asterisks mark the Meis2 subclass. f, Dendrogram showing consensus clusters of GABAergic neurons, with branches coloured by species mixture (grey, well mixed). g, Consensus cluster layers in humans (top) and mice (bottom). h, Dendrograms showing pairwise species integrations, coloured by subclass. i, Average classification performance (chance = 0.5) of gene sets for cell types within and between species. Linear regression fits are shown with black lines (slope at top left). j, Proportions of isoforms with a change in usage between species (humans, n = 15; mice, n = 15 cell subclasses). Box plots extend from 25th to 75th percentiles; central lines represent median value; whiskers extend to 1.5 times the interquartile interval.

