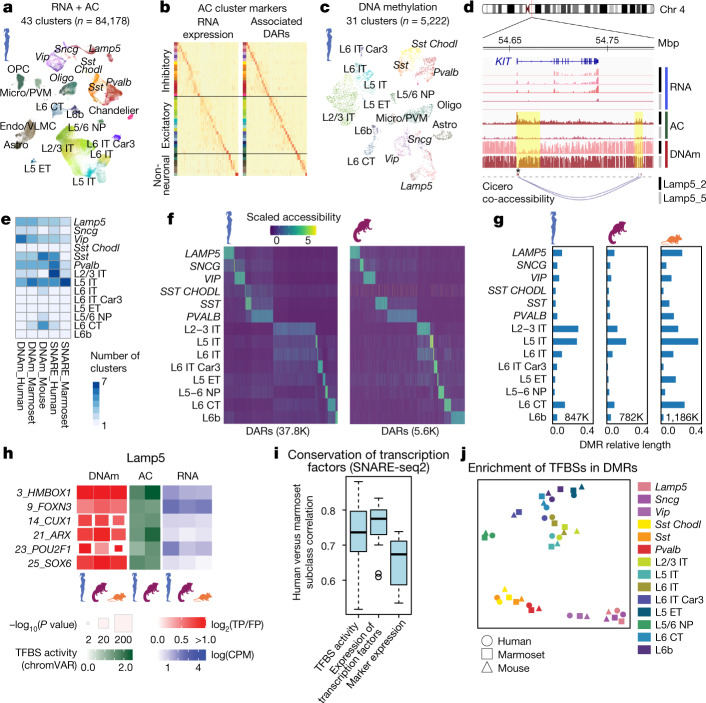
Fig. 3. Epigenomic profiling reveals gene-regulatory processes that define M1 cell types.
a, UMAP showing human M1 SNARE–seq2 data, labelled by cell subclass and AC cluster (colours). Astro, astrocyte; Car3, CAR3 gene; CT, corticothalamic cell; ET, extratelencephalic cell; IT, intratelencephalic cell; micro, microglia; NP, near-projecting; oligo, oligodendrocyte; OPC, oligodendrocyte precursor; PVM, perivascular macrophage. b, Heat maps showing the expression of markers of AC clusters and associated DARs. c, UMAP showing DNAm data from human M1, labelled by subclass and cluster (colour). d, Human genome tracks, showing AC and the hypomethylation (mCG) of DNA (DNAm) near KIT selectively in consensus cluster Lamp5_2. Co-accessible chromatin regions were identified by Cicero. e, Number of cell types identified for each technology and species varies across subclasses. f, Heat maps showing the activity of human and marmoset subclass DARs (K, thousands). g, Barplots showing the relative lengths of hypomethylated DMRs for subclasses across species, normalized by cytosine coverage genome-wide. Total DMRs are shown at the bottom. h, Left, conserved enrichment of transcription-factor motifs in DMRs (DNAm); TFBS activities in AC (using chromVAR); and expression of transcription factors, for Lamp5 neurons. CPM, counts per million; FP, false positive; TP, true positive. i, Correlations of cell subclasses (n = 13) between species for SNARE–Seq2 TFBS activities and expression of transcription factors and markers. Box plots extend from 25th to 75th percentiles; central lines represent medians; whiskers extend over 1.5 times the interquartile interval. j, t-distributed stochastic neighbour embedding (t-SNE) plot showing enrichment of TFBSs in DMRs.

