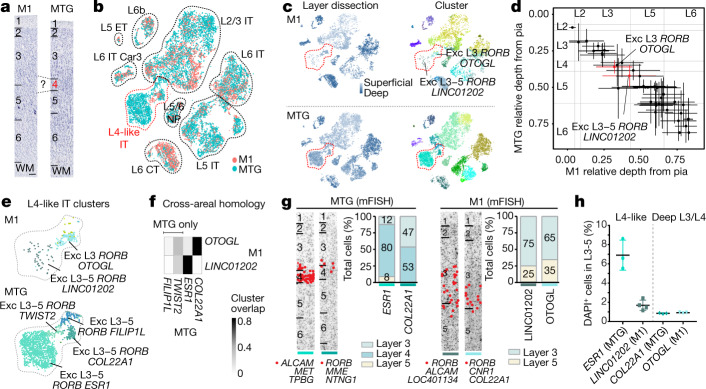
Fig. 4. L4-like neurons in M1.
a, L4 is present in human MTG not M1, on the basis of cytoarchitecture in Nissl-stained sections. b, t-SNE plot of integrated snRNA-seq from M1 and MTG glutamatergic neurons. c, Nuclei annotated on the basis of the relative depth of the dissected layer and within-area cluster. Two clusters from superficial layers are labelled (red dotted outline). d, Estimated relative depth from pia (mean ± s.d.) of M1 glutamatergic clusters (n = 44) and closest matching MTG neurons. Approximate layer boundaries are indicated (grey lines). e, Magnified view of L4-like clusters in M1 and MTG. f, Overlap of M1 and MTG clusters in integrated space identifies homologous and MTG-specific clusters. g, Multicolour FISH (mFISH) quantifies differences in layer distributions for homologous types between M1 and MTG. Cells (red dots) in each cluster were labelled using the markers listed below each representative inverted image of a DAPI-stained cortical column. DAPI, 4′,6-diamidino-2-phenylindole. h, ISH-estimated frequencies (mean ± s.d.) of homologous clusters (ESR1, n = 3; LINC01202, n = 4; COL22A1, n = 3; OTOGL, n = 3 samples).

