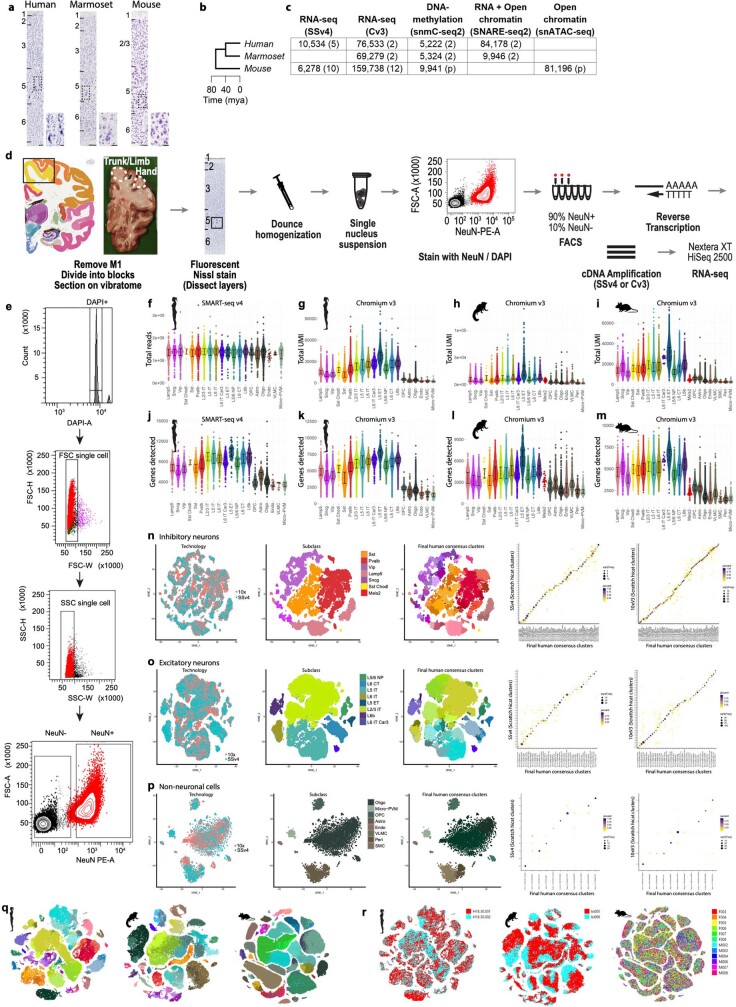
Extended Data Fig. 1. Metrics of RNA-seq quality and integration of human datasets.
a, Nissl-stained sections of M1, annotated with layers and showing the relative expansion of cortical thickness (particularly of L2 and L3 in primates) and large pyramidal neurons or ‘Betz’ cells in human L5 (black dotted outline, with high-magnification adjacent panel). Scale bars, 100 μm (low magnification), 20 μm (high magnification). M1 was identified in each species from its cortical location and histological features. b, Phylogeny of species; mya, millions of years ago. c, Number of nuclei included for analysis in each molecular assay. Numbers of donors are in parentheses; ‘p’ indicates pooled biological replicates. All assays used nuclei isolated from the same donors in humans and marmosets. 15,842 nuclei were also profiled from L5 in macaques (n = 3) using Cv3. d, Workflow showing the isolation of single nuclei from M1 of post-mortem human brain and profiling with RNA-seq. The black outline in the Nissl image highlights a cluster of Betz cells in L5. e, FACS gating scheme for sorting nuclei. f, Using SSv4, we sequenced more than one million total reads across all subclasses in humans. g–i, Cv3 analysis shows that total unique molecular identifiers (UMIs) vary between subclasses, and that these differences are shared across species. For each subclass, single nuclei are plotted together with median values and interquartile intervals. j–m, Gene detection (expression level greater than 0) is highest in human when using SSv4 (j) and lowest for marmosets when using Cv3 (l). Note that the average read depth used for SSv4 was approximately 20-fold greater than that for Cv3 (target 60,000 reads per nucleus). For each subclass, single nuclei plus medians and interquartile intervals are plotted. n–p, Integration of SSv4 and Cv3 RNA-seq datasets from human single nuclei isolated from GABAergic (n) and glutamatergic (o) neurons and non-neuronal cells (p). Left three panels, UMAP visualizations, coloured by RNA-seq technology, cell subclass, and unsupervised consensus clusters. Right two panels, confusion matrices show membership of SSv4 and Cv3 nuclei within 127 integrated consensus clusters. q, r, t-SNE projections of single nuclei, based on expression of several thousand genes with variable gene expression and coloured by cluster label (q) or donor (r). Clusters are well separated in all species, and nuclei from different donors are well mixed within clusters, with some donor-specific technical effects in marmosets.

