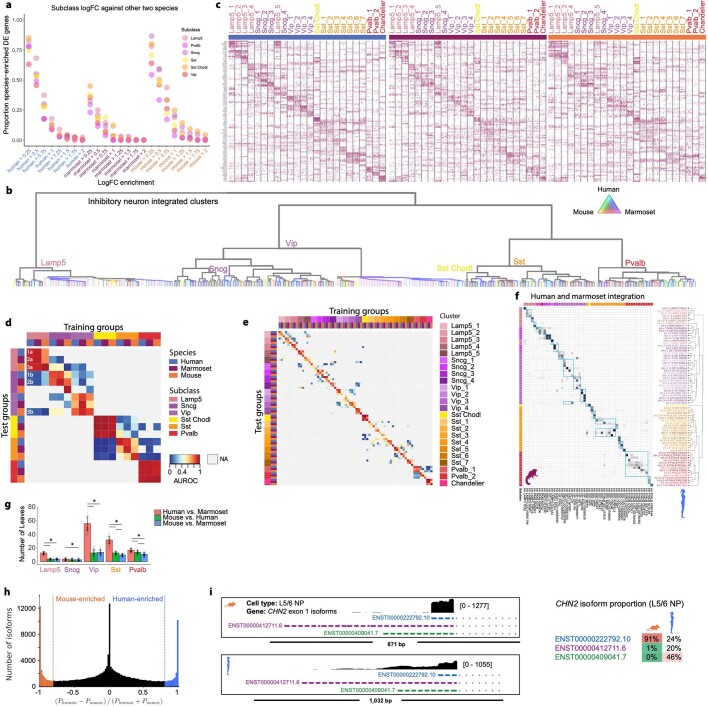
Extended Data Fig. 3. RNA-seq integration of GABAergic neurons across species.
a, Dot plot showing the proportion of species-enriched subclass marker genes (from Fig. 2c, d) that show log-transformed fold change (logFC) enrichment over the same subclass from the other two species. b, Dendrogram showing clusters of GABAergic (inhibitory) neurons from unsupervised clustering of integrated RNA-seq data from humans, marmosets and mice. The branch thickness indicates the relative number of nuclei, and the branch colour indicates species mixing (grey is well mixed). Major branches are labelled by subclass. The dendrogram in Fig. 2f was derived from this tree by pruning species-specific branches. c, Heat maps showing scaled expression of the top five marker genes for each GABAergic cross-species cluster, and five marker genes for Lamp5 and Sst clusters. Initial genes were identified by performing a Wilcox test of every integrated cluster against all other GABAergic nuclei. Additional DEGs were identified for Lamp5 and Sst cross-species clusters, by comparing one of the cross-species clusters with all other related nuclei (for example, Sst_1 against all other Sst clusters). d, e, Heat map showing ‘one versus best MetaNeighbour’ scores for GABAergic subclasses (d) and clusters (e). Each column shows the performance of a single training group across the three test datasets. AUROCs are computed between the two closest neighbours in the test dataset, where the closer neighbour will have the higher score, and all others are shown in grey (NA). For example, in d the first column contains results of training on human Lamp5, labelled with numbers to indicate test datasets, where 1 is human, 2 is marmoset and 3 is mouse, and letters to indicate closest (a) and second-closest (b) neighbouring groups. Dark red three-by-three blocks along the diagonal indicate high transcriptomic similarity across all three species. f, Heat map showing cluster overlaps obtained from pairwise human–marmoset Seurat integration, indicating the proportion of within-species clusters that coalesce within integrated clusters. Columns and rows are ordered as in Fig. 2e, with cross-species consensus clusters indicated by blue boxes. The top and left colour bars indicate subclasses of within-species clusters. g, Bar plots quantifying the number of well mixed leaf nodes (mean ± s.d.; n = 100 subsamples) in dendrograms of pairwise species integrations from Fig. 2h. ANOVA tests for each subclass were followed by two-sided Tukey’s HSD tests with Bonferroni correction for multiple comparisons; degrees of freedom = 297; *P < 0.0001. h, Histogram showing the relative difference in isoform genic proportion (P) between humans and mice for all subclass comparisons. All moderately to highly expressed isoforms were included (gene TPM greater than 10 in both species; isoform TPM greater than 10 and proportion greater than 0.2 in either species). Vertical lines indicate a more than ninefold change in mice or humans. i, Genome-browser tracks of RNA-seq (SSv4) reads in human and mouse L5/6 NP neurons at the CHN2 locus for the three most common isoforms. The short isoform of CHN2 is predominantly expressed in mouse neurons; longer isoforms are also expressed in human neurons.

