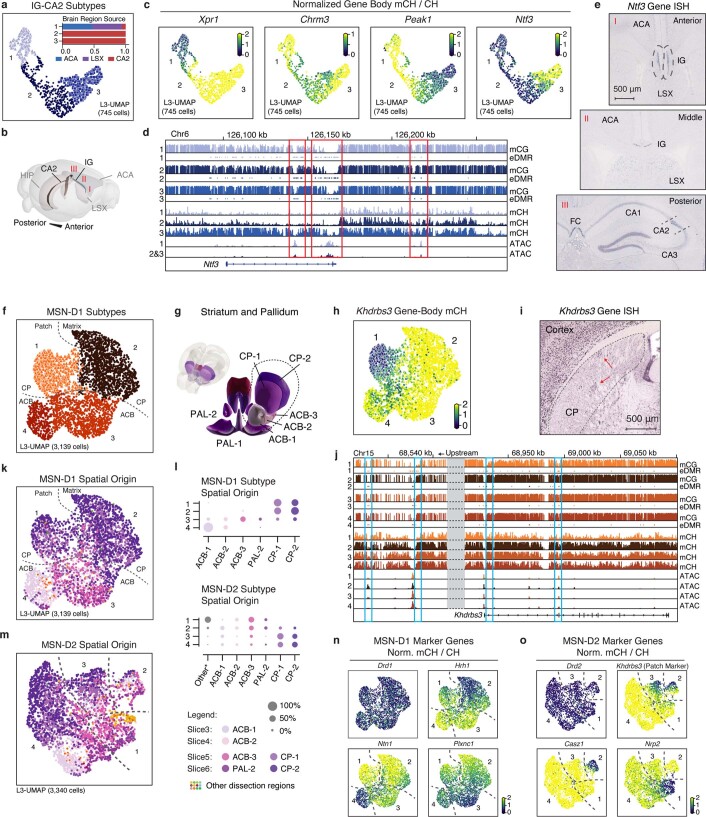
Extended Data Fig. 4. Supporting details of cellular and spatial diversity of neurons at the subtype level.
a, Level 3 UMAP of IG-CA2 neurons coloured by subtypes. Bar plot showing sub-region composition of the subtypes: (1) Xpr1, (2) Chrm3, and (3) Peak1. b, The 3D model illustrates the spatial relationships between related anatomical structures. c, mCH fraction of marker genes in IG-CA2 cells. d, Methylome, and chromatin accessibility genome browser view of Ntf3 genes and its upstream regions. ATAC and eDMR information are from Fig. 4 analysis. e, Three different views of the in situ hybridization experiment (source: https://mouse.brain-map.org/gene/show/17972; the same patterns were shown in three biological replicates) from Allen Brain Atlas48, showing the Ntf3 gene expressed in both IG and CA2. f, Level 3 UMAP of MSN-D1 neurons coloured by subtype. Numbers indicate four subtypes: (1) Khdrbs3, (2) Hrh1 (3) Plxnc1, and (4) Ntn1. g, The 3D model of related striatum dissection regions. h, i, mCH fraction (h), and an in situ hybridization experiment (source: https://mouse.brain-map.org/gene/show/13769; the same patterns were shown in two biological replicates) from Allen Brain Atlas48 (i) of the Khdrbs3 gene, red arrows indicate patch regions in CP. j, Genome browser view of Khdrbs3 genes similar to d. k, Level 3 UMAP of MSN-D1 neurons coloured by dissection regions. l, The region composition of each subtype of MSN-D1 and MSN-D2. m, MSN-D2 subtypes: (1) Nrp2, (2) Casz1, (3) Col14a1, and (4) Slc24a2. n, o, mCH fraction of MSN-D1 (n) and MSN-D2 (o) subtype marker genes. All brain atlas images (b, g) were created based on Wang et al.16 and © 2017 Allen Institute for Brain Science. Allen Brain Reference Atlas. Available from: http://atlas.brain-map.org.

