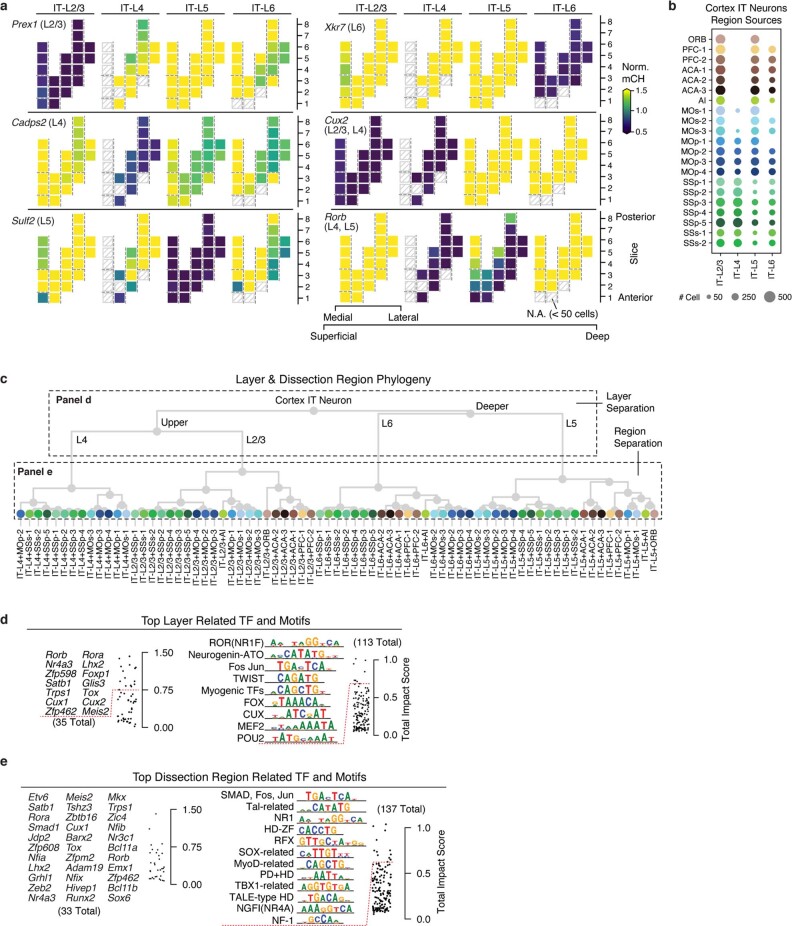
Extended Data Fig. 9. DNA methylation gradient of IT neurons.
a, Representative marker genes for laminar layers separation. The same dissection region layout in Fig. 5b was used here. b, Layer-dissection-region cell group taxonomy. c, Dot plot sized by the number of cells in each layer-dissection-region combination in excitatory IT neurons. Each group needs at least 50 cells to be included in the analysis. d, e, The top layer (d) and dissection region (e) for related TFs and JASPAR motifs ranked by total impact score.

