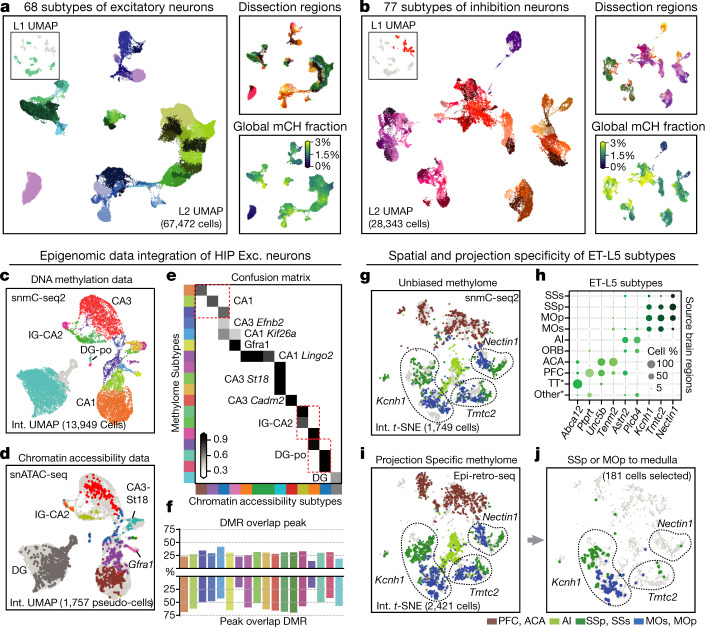
Fig. 2. Epigenomic diversity of neurons.
a, b, Level 2 UMAP of excitatory (a) and inhibitory (b) neurons, coloured by subtype, dissection region and global mCH fraction. c, d, Integration UMAP of the HIP excitatory neurons profiled by snmC-seq2 (c) and snATAC-seq (d; shows pseudo-cells). e, Overlap score of a-types and m-types. f, Overlap of CG-DMR and ATAC peaks in matched subtypes. g, i, j, Integration t-SNE of ET-L5 neurons profiled by snmC-seq2 (g) and epi-retro-seq (i, j), coloured by dissection region. Three SSp- and MOp-enriched subtypes are labelled by their marker gene. j, Medulla projecting neurons from SSp or MOp only. h, Spatial composition of ET-L5 subtypes.

