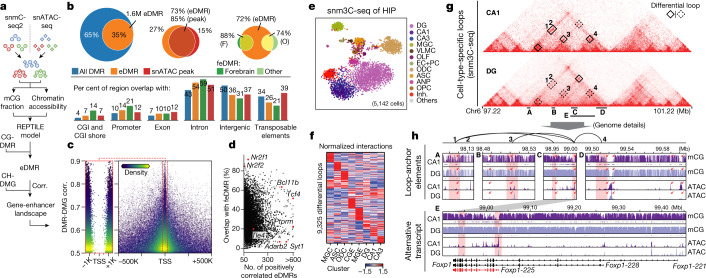
Fig. 4. Gene–enhancer landscapes in neuronal subtypes.
a, Schematic of enhancer calling using matched DNA methylome and chromatin accessibility subtype profiles. Corr., correlation. b, Overlap of regulatory elements identified in this study and other epigenomic studies (ATAC peaks3 and feDMRs8). c, DMR–DMG correlation and the distance between DMR centre and gene TSS; each point is a DMR–DMG pair coloured by kernel density. d, Percentage of positively correlated eDMRs that overlap with forebrain feDMRs in each gene. e, t-SNE of cells analysed by sn-m3C-seq coloured by assigned major cell types. f, Interaction level (z-score across rows and columns) of differential loops in eight clusters at 25-kb resolution. g, h, Epigenomic signatures surrounding Foxp1. g, Triangle heat maps showing CA1 and DG chromatin contacts and differential loops. h, Genome browser sections showing detailed mCG and ATAC profiles near anchors of four CA1-specific loops. Red rectangles indicate loop anchors and red arrows indicate notable regulatory elements.

