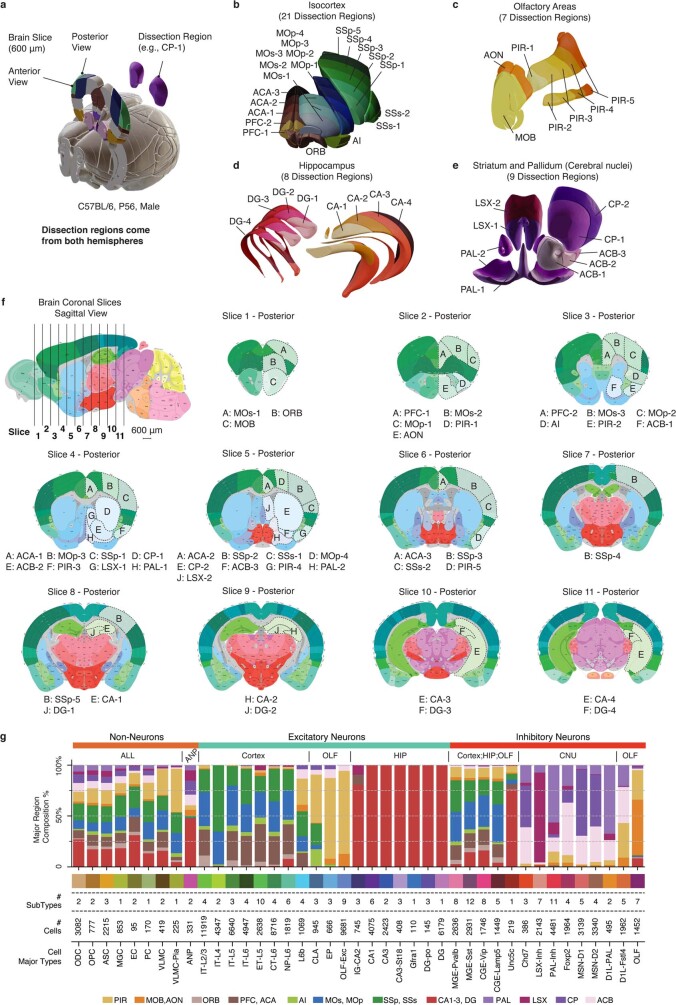
Extended Data Fig. 1. Brain dissection regions.
a, Schematic of brain dissection steps. Each male C57BL/6 mouse brain (age P56) was dissected into 600-μm slices. We then dissected brain regions from both hemispheres within a specific slice. b–e, 3D mouse brain schematic adapted from Allen CCFv3 to display the four major brain regions and 45 dissection regions. Each colour represents a dissection region. f, 2D mouse brain atlas adapted from Allen Mouse Brain Reference Atlas, the first sagittal image showing the location of each coronal slice, followed by 11 posterior view images of all coronal slices, the same 45 dissection regions are labelled on the corresponding slice. All coronal images follow the same scale as the sagittal image. The posterior view of each slice is the anterior view of the next slice. g, An integrated overview of brain region composition, subtype and cell numbers of the major types. All brain atlas images were created based on Wang et al.16 and © 2017 Allen Institute for Brain Science. Allen Brain Reference Atlas. Available from: http://www.atlas.brain-map.org.

