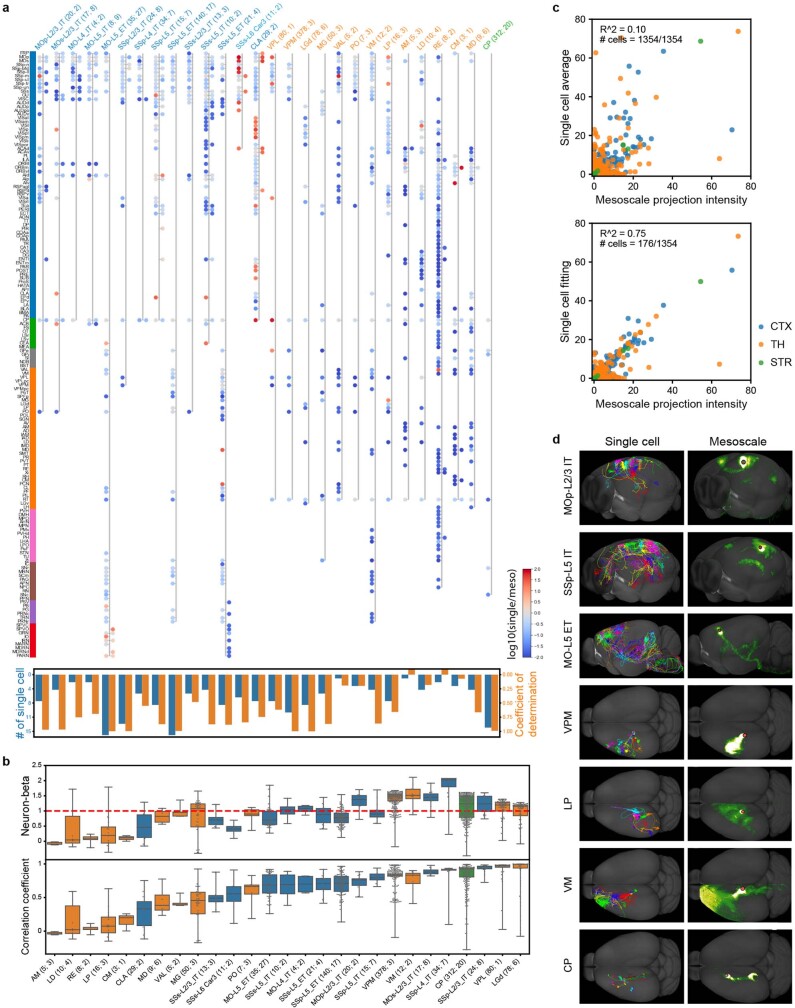
Extended Data Fig. 6. Combination of single neuron morphologies recapitulates population-level mesoscale projection patterns.
a, Comparative projection map of single cells and mesoscale experiments. Individual samples are grouped by brain areas and/or cortical layers based on soma locations (single cell) and injection sites (mesoscale). This dataset covers 14 cortical areas and layers combined, 13 thalamic nuclei and one striatal structure (CP). Each group is represented by a stretch of connected dots with ipsilateral and contralateral targets in the two hemispheres, respectively. Projection intensities in each target region are quantified as ln(NPV × 100 + 1) for mesoscale experiments, where NPV denotes normalized projection volume (Supplementary Table 3), and axon lengths within the target region for single cells. Target regions are defined using thresholds of ln(NPV × 100 + 1) > 0.2 for mesoscale experiments and axon length > 1 mm for single cells. Only target regions present in at least 50% mesoscale experiments or 10% single cells are shown here. Dot colors are scaled by the log10 of single-cell and mesoscale strength ratio. Lower panel, coefficients of determination (orange bars) and number of cells (blue bars) of mesoscale regression by single cells (described in c). b, Box plots of neuron-beta and correlation coefficients between single cells and group-average of mesoscale data. Individual comparisons shown as swarm plots overlapped with boxes. Box plot specifications: box bounds = 25th and 75th percentile, center = 50th percentile, minima/maxima = center ± 1.5 × IQR (75th percentile – 25th percentile), no whiskers shown. The first and second numbers in the group labels in a and b indicate the numbers of single cells and mesoscale experiments, respectively. To quantitatively compare the single cell and mesoscale tracer experiments, we calculated the correlation coefficient of each single cell’s brain-wide projection weights with the average projection weights from the location-matched mesoscale experiments. The correlation coefficients range from −0.04 (i.e., AM) to 1.00 (i.e., LGd), with a median of 0.69. High correlation coefficients may indicate simple compositions of projecting patterns, e.g., LGd with almost pure VISp projections and CP projecting mainly to either GPe or SNr. Low correlation coefficients may indicate complex composition of projecting patterns, e.g., AM, RE and CM for reasons mentioned below. To compare single cell projection strength relative to mesoscale data, we developed a ‘Neuron-beta’ metric, as the covariance of a single cell and the average of mesoscale samples, relative to the mesoscale variance. Single cells with Neuron-beta values > 1.5 correlate well with mesoscale data but fluctuate more variably. For example, individual VM neurons are highly diverse but positively correlated with mesoscale data. Small (< 0.5) positive Neuron-beta values result from low correlation of single cell and mesoscale data. For cell types with Neuron-beta values around 1, single cell and mesoscale data appear to be comparable. c, Approximation of mesoscale projections by single cell projection strengths (1,354 cells used) by group-average (upper) or by linear regression (lower). To study how well the mesoscale projection pattern could be broken down to our set of single cells, we performed linear regression with Lasso regularization to reduce the number of single cells with non-zero weights (representative cells). This approach selects a minimal set of single cells and uses weighted summation of single cell axon length to approximate the cell type specific mesoscale axonal weights. The overall coefficient of determination (R2) is 0.75, indicating that mesoscale connectivity is recapitulated well except for the above-mentioned thalamic nuclei. Only 176 out of 1,354 single cells contribute to the regression. These cells represent a minimal set of stereotypes to make up the population level connectivity (see d). Averaging across all single cells shows a low level of approximation (R2 = 0.10), suggesting highly diverse morphologies and projection patterns among the single cells. d, Visualization of projection patterns constituted by representative cells and mesoscale projection intensities. Overall, the combined single cell projection pattern from a given region (and cortical layer) is highly concordant with that of the mesoscale experiments. There are a few exceptions to this general trend. The combined patterns from single cortical and CLA Car3 neurons collectively project to more targets than mesoscale experiments, likely due to the richer sampling of single neurons across multiple cortical areas and along the entire extent of CLA than the few mesoscale experiments covered. On the other hand, for several thalamic nuclei (e.g., VAL, VM, AM, RE and CM), single neurons collectively have not captured the full projection patterns from mesoscale experiments. This difference could be due to several reasons: (1) since some of these nuclei are small, the mesoscale experiments may include projections labeled from neighboring nuclei so the single cell data may more accurately represent the true output pattern; (2) the number of reconstructed single neurons is still small and may not fully represent all projection types in a given nucleus; (3) the reconstructed neurons may represent only a subset of the cell types located in these nuclei, and there may be other types of projection neurons not labeled in the Cre lines used here.

