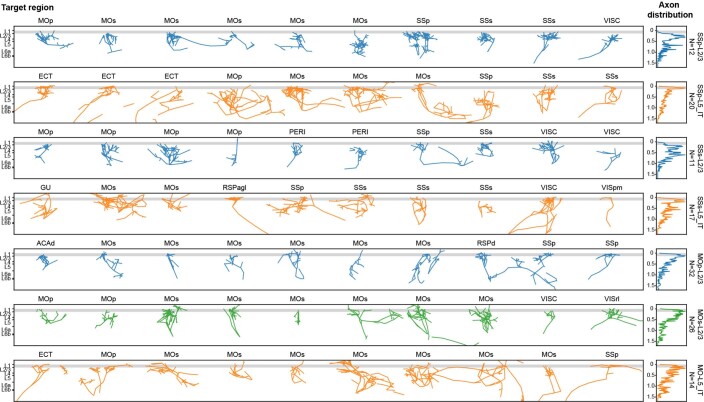
Extended Data Fig. 8. Comparison of terminal axon arbor patterns in target cortical regions between L2/3 and L5 IT neurons.
Axon terminals in specific target regions (labeled on top) of L2/3 or L5 IT neurons from SSp (first two rows), SSs (next two rows), MOp and MOs (last three rows). Because not all neurons project to all target regions, axon terminals from any neurons for each target region are combined. For each neuron type from each region, 10 representative axon terminals are shown here, whereas the overall vertical profile of axon distributions (the rightmost panel) is quantified from all axonal terminals (N indicated below each neuron type label). These axon distribution vertical profiles are also presented in Fig. 2d. Due to variation in layer thickness in different parts of the cortical areas, only generic L1 is shaded.

